- DOT is still on a rampage higher, helped by a rediscovered interest in cryptocurrencies.
- DOT needs to break $27, which is a double resistance level.
- Further upside is possible as long as favorable tailwinds remain present.
Polkadot (DOT) has had an excellent run higher. A well-respected green ascending trend line has been formed and still shows importance and strength in the coming days. To the upside, however, price action is limited for now, with the 200-day Simple Moving Average (SMA) at $27 and the high of June 4 blocking the path. The risk of a double top formation could spell some short-term issues for price action. DOT could face a minor correction to the downside with a test of the green trend line as supportive action.
DOT is in a triangle formation, and a push to the upside looks inevitable
Do not expect the push to come just yet. A break higher out of the triangle looks instead set for the end of August. Buyers will need to step in each time and defend the ascending green trend line. This way, short-sellers will get squeezed out of their short positions with stops tucked away just above $27. Expect those stops to be run once the price breaks above and buyers to look for $29 as the next profit-taking level.
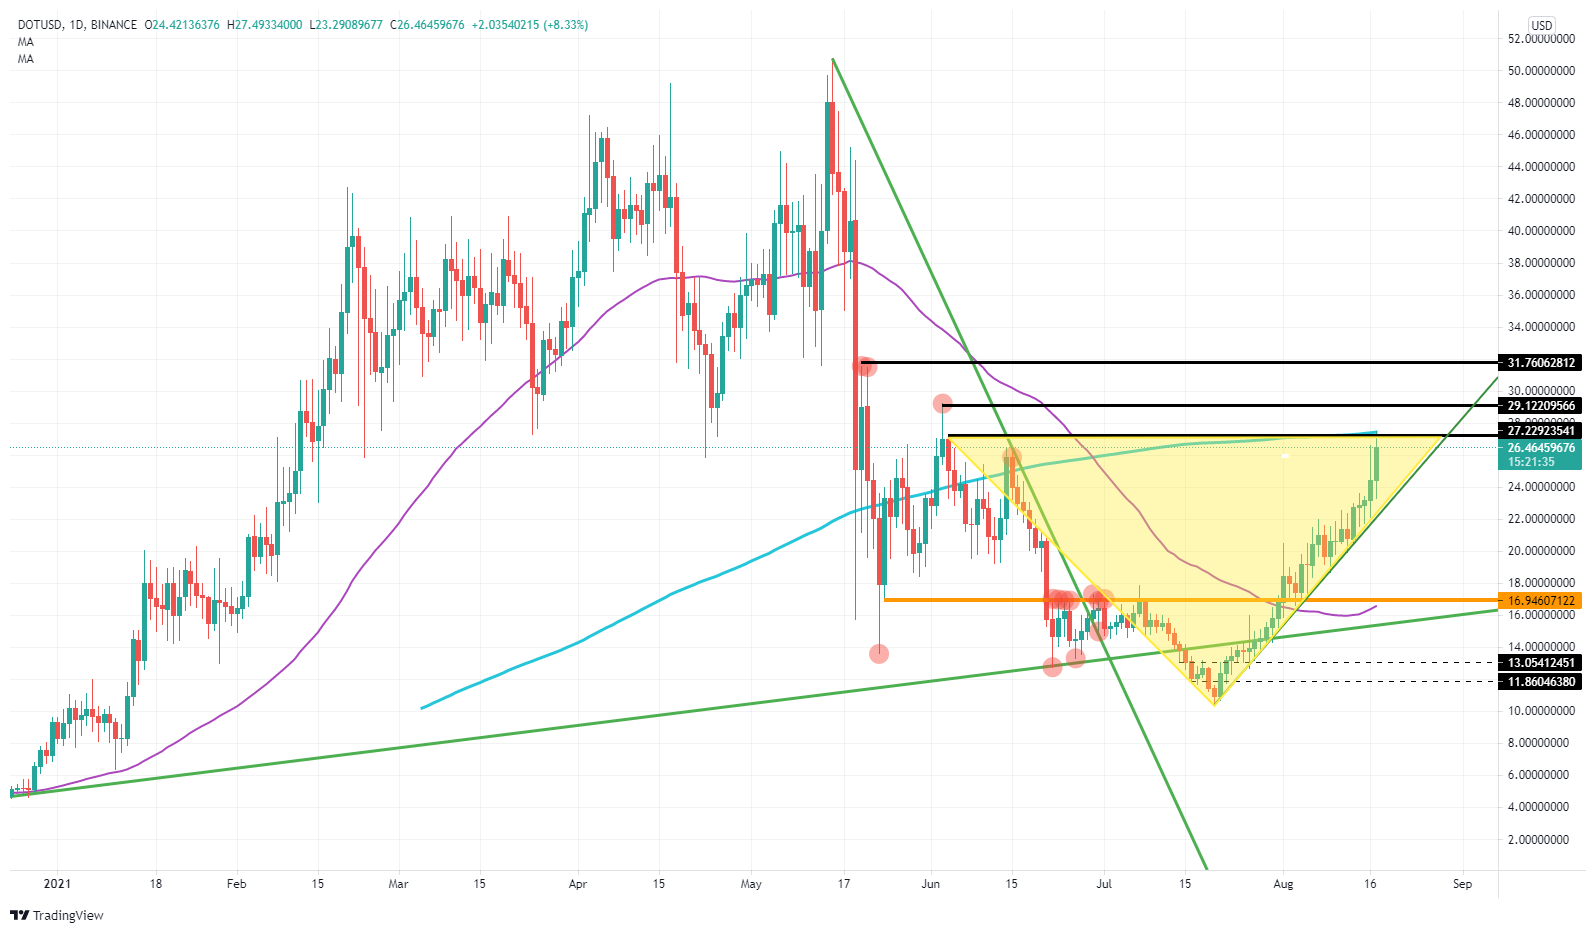
Polkadot is, therefore, set to run higher. The ultimate level to watch beyond $29 will be $31.76. Key will be that the green ascending trend line stays confirmed. If that should give way, expect a big squeeze against buyers, with prices dropping to $16.95. DOT has the orange horizontal support that originated on May 24. It is a significant level of interest since around August 4, price action first broke above, came back to test and rebounded off that level to jump higher. This is the best possible technical setup for a long. Should DOT correct, expect this level to be defended by buyers who have their stops just below $16.
Information on these pages contains forward-looking statements that involve risks and uncertainties. Markets and instruments profiled on this page are for informational purposes only and should not in any way come across as a recommendation to buy or sell in these assets. You should do your own thorough research before making any investment decisions. FXStreet does not in any way guarantee that this information is free from mistakes, errors, or material misstatements. It also does not guarantee that this information is of a timely nature. Investing in Open Markets involves a great deal of risk, including the loss of all or a portion of your investment, as well as emotional distress. All risks, losses and costs associated with investing, including total loss of principal, are your responsibility. The views and opinions expressed in this article are those of the authors and do not necessarily reflect the official policy or position of FXStreet nor its advertisers. The author will not be held responsible for information that is found at the end of links posted on this page.
If not otherwise explicitly mentioned in the body of the article, at the time of writing, the author has no position in any stock mentioned in this article and no business relationship with any company mentioned. The author has not received compensation for writing this article, other than from FXStreet.
FXStreet and the author do not provide personalized recommendations. The author makes no representations as to the accuracy, completeness, or suitability of this information. FXStreet and the author will not be liable for any errors, omissions or any losses, injuries or damages arising from this information and its display or use. Errors and omissions excepted.
The author and FXStreet are not registered investment advisors and nothing in this article is intended to be investment advice.
Recommended Content
Editors’ Picks
Ripple's move above this key level could trigger nearly 50% rally for XRP
Ripple has overcome a critical resistance level and flipped into a support floor on the weekly time frame. This development happened while XRP tightly consolidated for roughly 250 days. Investors can expect XRP to kickstart a massive rally.
Optimism price outlook with nearly $90 million worth of OP tokens flooding markets on Friday
Optimism volatility has shrunk in the ours leading to the network’s cliff unlock. It joins the likes of dYdX and Sui, which have similar events on their calendars. As token unlocks are often considered bearish catalysts, investors should brace for a reaction after the event.
Top 3 Price Prediction Bitcoin, Ethereum, Ripple: Retail watches from the sidelines with a bias for shorts
Bitcoin could clear $73,777 peak as BTC bulls resurface. Ethereum might fall 10% before next leg up as ETH RSI teases with sell signal. XRP could lose $0.6000 threshold as Ripple bulls fail to show up.
Jito price could hit $6 as JTO coils up inside this bullish pattern
Jito price action shows a potential cup and handle formation. Based on theoretical measurement rules, a successful breakout could yield a 56% rally to $6.0. A breakdown of the $3.86 support level would create a lower low for JTO and invalidate the bullish thesis.
Bitcoin: BTC may have recovered, but is it out of the woods?
Bitcoin’s (BTC) upward momentum has shown a significant decline for the past two weeks or so. This development led to a bearish signal on the weekly and an uncertain outlook on the monthly.