Polkadot Price Prediction: Aiming for shortterm targets might be problematic
- Polkadot price is witnessing a rejection near the mid $6.00 level as two key indicators have forged a barrier.
- DOT price fell extremely over sole territory but displayed bullish divergence.
- Invalidation of the bearish thesis is a breach above $8.83

Polkadot price may be a challenging chart to forecast in the days to come. Still the technicals point south on larger time frames.
Polkadot price is a tricky short-term chart.
Polkadot price has displayed volatile market behavior recently as the price has ricocheted between $5.60 and $6.20 in an unpredictable fashion. Although the market may continue its volatile streak, scalping DOT price for short-term directions could be problematic in the grand scheme of things.
Polkadot price currently auctions at 6.08. The 8-day exponential (EMA) and 21-day simple (SMA) have formed barriers of resistance near $6.20. The rejection comes after DOT’s impressive 10% rally in 24 hours following the US- Consumer Price Index report. Before the ascension, DOT fell into extremely oversold territory on the Relative Strength Index and showed bullish divergence with the September lows. The subtle bullish signal justified early bulls to enter the market and the 10% rally displayed.
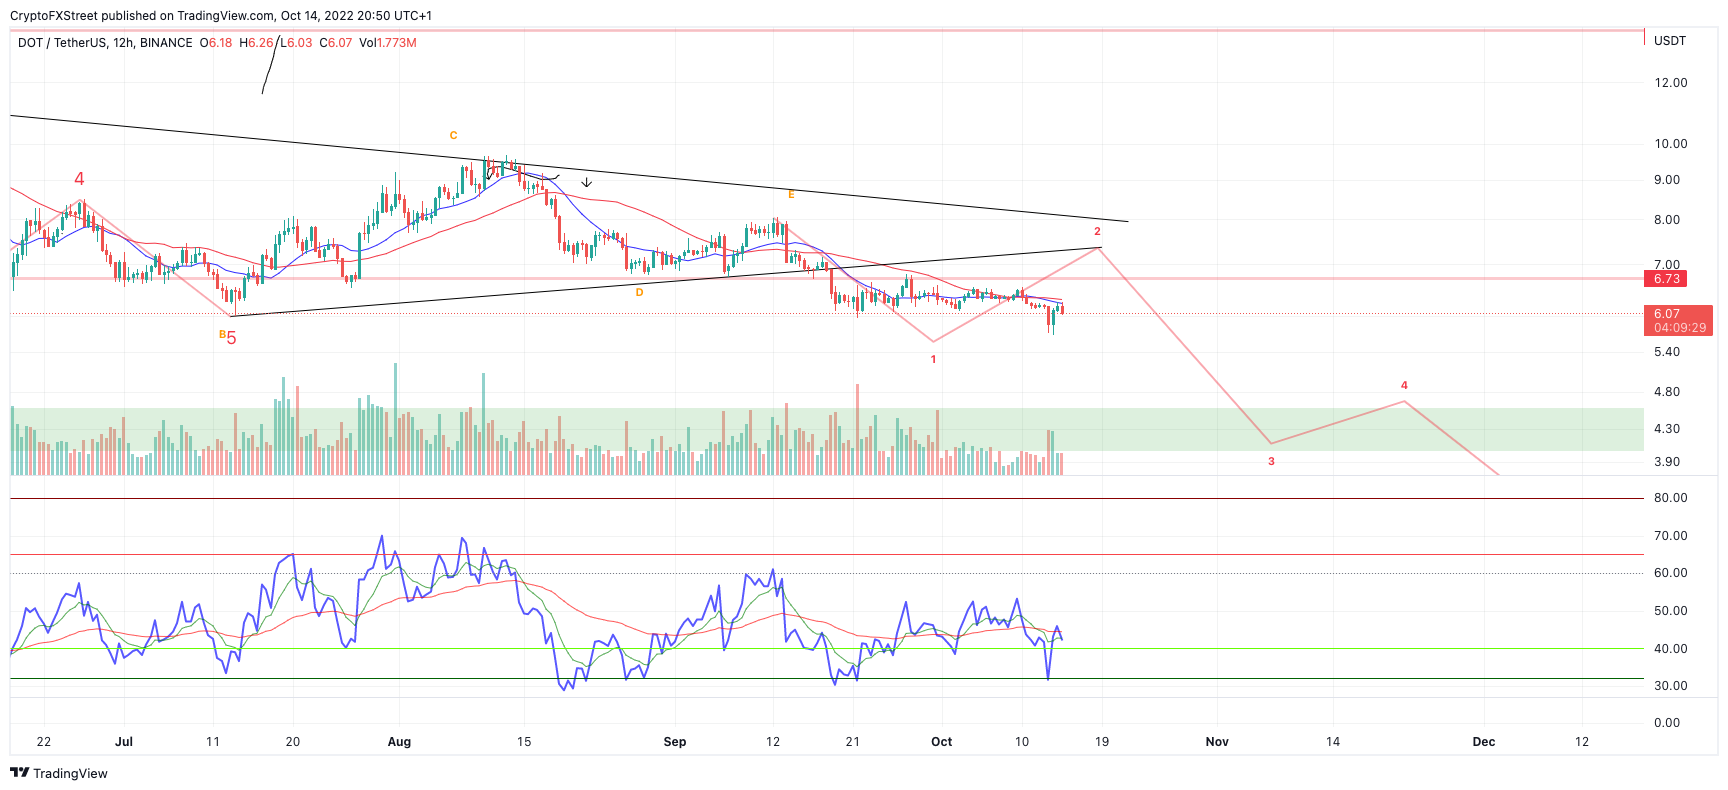
DOT/USDT 12-Hour Chart
Polkadot price now has a decision to make. Early bulls may have already taken partial or all of the profits, but an additional spike toward the $7.00 congestion zone is a reasonable possibility. However, if there is no underlying support at the $6.00 level, the DOT pricer could retest the lows at $5,60 in the coming days.
DOT price is still well within the bounds of a downtrend based on several confounding indicators. Invalidation of the bearish trend could occur if the bulls conquer the $8.83 swing high. In doing so, the bulls could set up a retest of the $10 price levels, resulting in an 88% increase from the current Polkadot price.
In the following video, our analysts deep dive into the price action of Polkadot, analyzing key levels of interest in the market. -FXStreet Team
Author

Tony M.
FXStreet Contributor
Tony Montpeirous began investing in cryptocurrencies in 2017. His trading style incorporates Elliot Wave, Auction Market Theory, Fibonacci and price action as the cornerstone of his technical analysis.


