|

Why Polkadot Price may have started the move down to $3

  • Polkadot price has breached a descending triangle to the downside.
  • There is a subtle uptick in transactions amidst the decline,
  • Invalidation of the bearish thesis is a breach above $7.80.

Polkadot price may be headed for a sharp decline. Key levels have been identified.

Polkadot price headed south.

Polkadot price could witness a sharp decline during October. Since The beginning of September, DOT's price has lost 20% of its market value. The steep decline could be the start of a 50% decline.

Polkadot price currently auctions at $6.26. The bears have forged a close into oversold territory on the Relative Strength Index. The bulls have lost support from the 21-day simple and 8-day exponential moving averages. Lastly, there is an uptick within the decline compared to the previous decline and congestion zone.

tm/dot/9/30/22

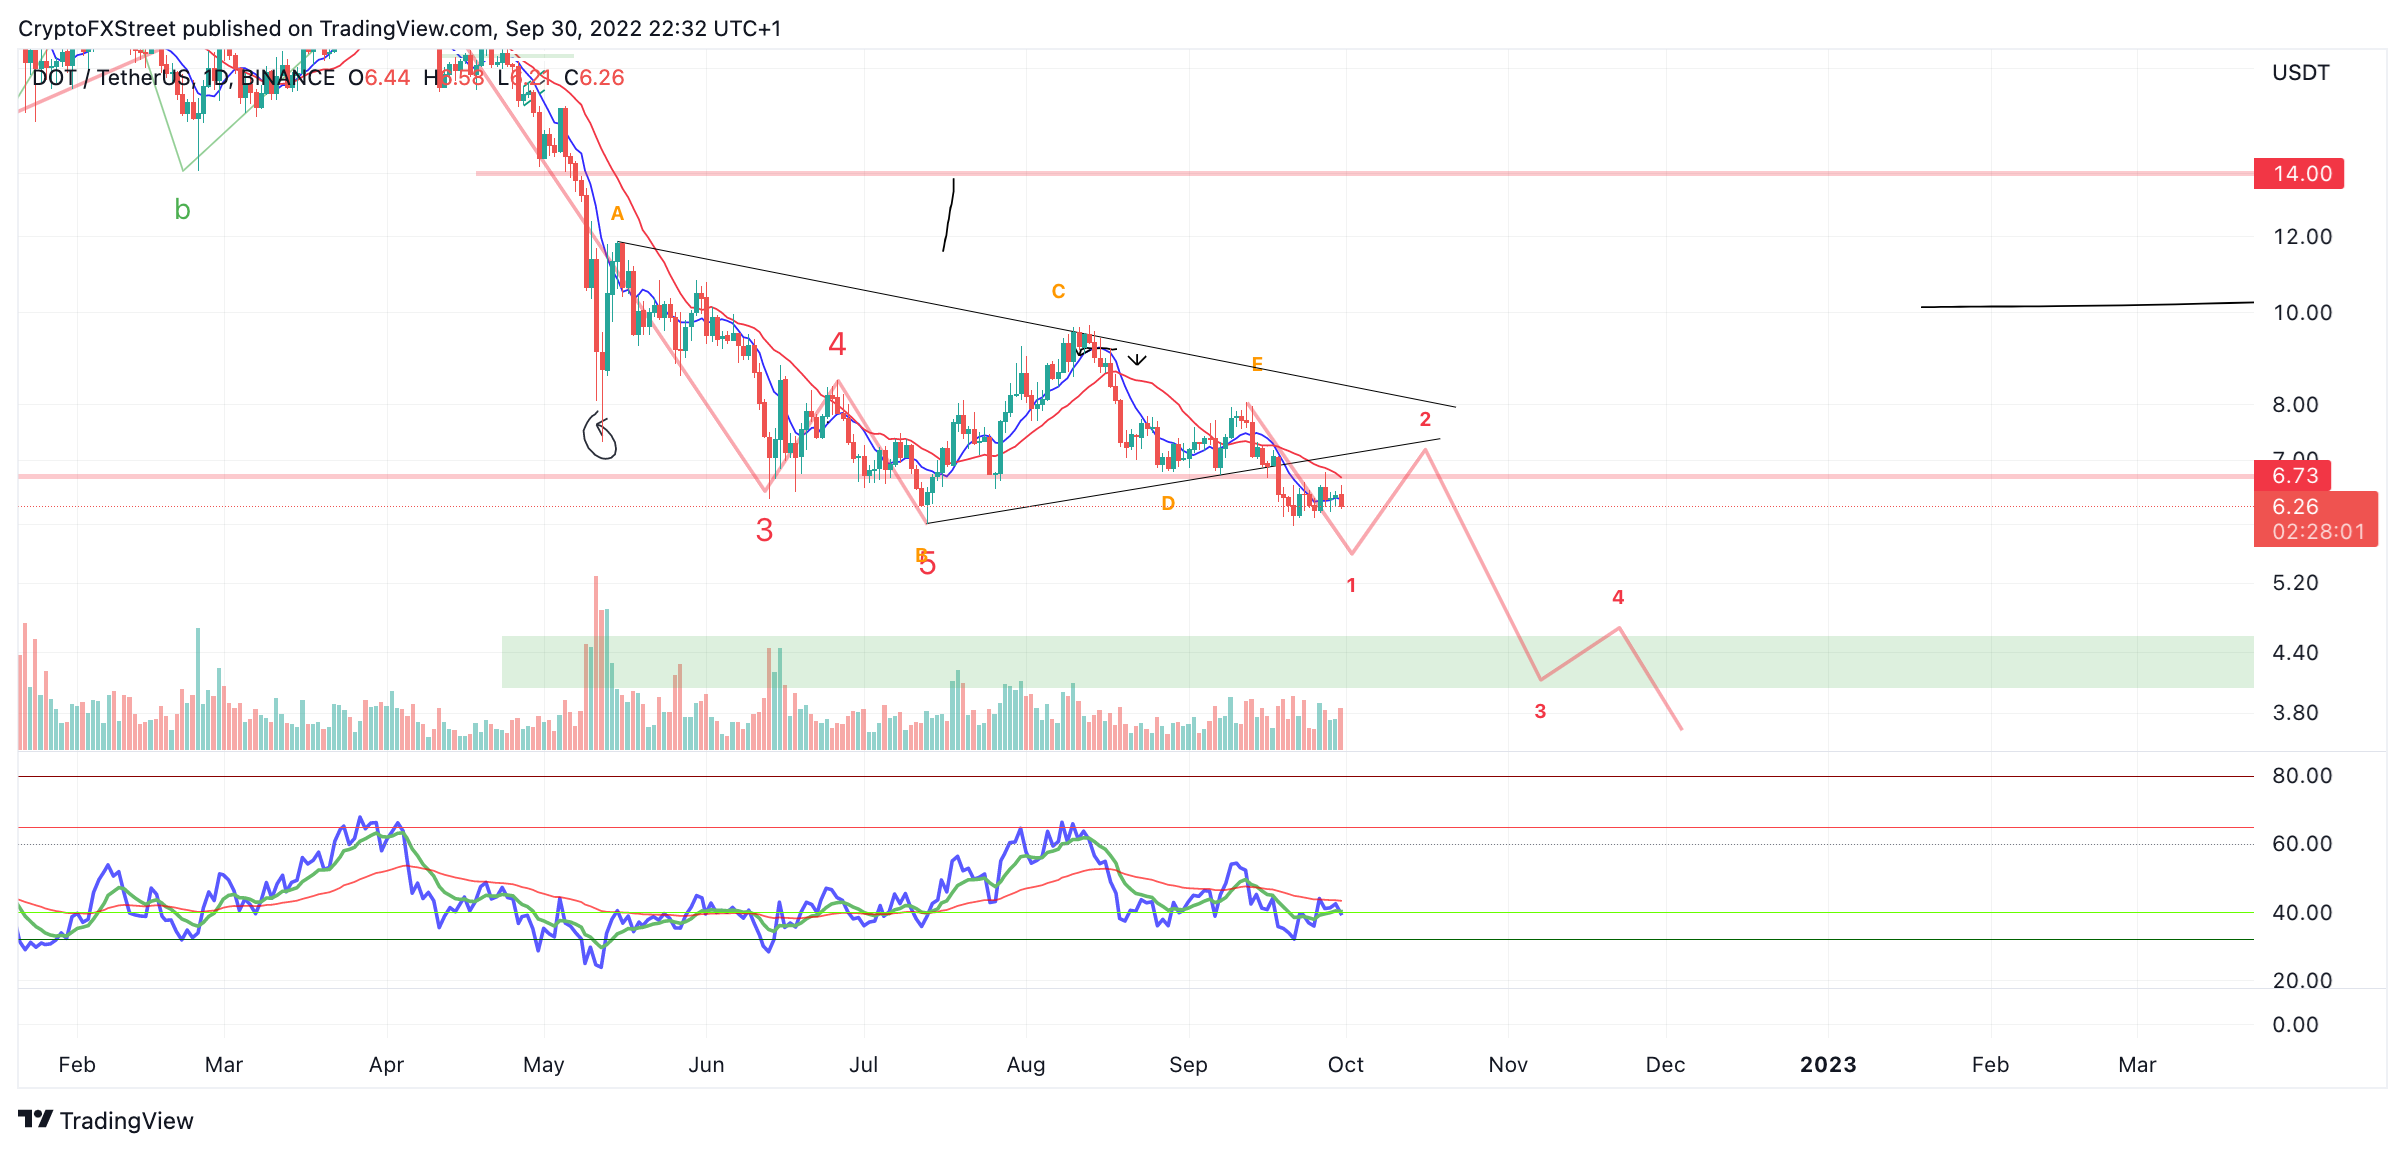
DOT USDT 1-Day Chart

Combining these factors, DOT price may have completed the triangle pattern. A breach of the previous swing low at $6.00 is the final confirmation necessary. If the technicals are correct, the triangle could prompt a 50% rally to the downside targeting $3.00. Invalidation of the bearish thesis is a breach above the previous upswing at $7.80.

In the following video, our analysts deep dive into the price action of Polkadot, analyzing key levels of interest in the market. -FXStreet Team

Author

Tony M.

Tony M.

FXStreet Contributor

Tony Montpeirous began investing in cryptocurrencies in 2017. His trading style incorporates Elliot Wave, Auction Market Theory, Fibonacci and price action as the cornerstone of his technical analysis.

More from Tony M.
Share:

Editor's Picks

Crypto Today: Bitcoin, Ethereum, XRP trade under sustained selling pressure despite mild ETF inflows

Cryptocurrency prices remain under pressure as a risk-off mood persists on Friday, with Bitcoin consolidating its losses above $62,000. Altcoins, including Ethereum and Ripple, are extending their weakness, trading near lower support levels around $1,600 and $1.12, respectively.

Bitcoin Weekly Forecast: After the bloodbath, everyone looks at $60,000

Bitcoin (BTC) hovers above $62,000 at the time of writing on Friday, weighed down by growing risk-off sentiment due to persistent geopolitical tensions in the Middle East and sticky macroeconomic uncertainty.

Cardano hits five-year low even as Hoskinson clarifies "break" isn't an exit

Cardano price is down 10% at press time on Friday, extending losses over 30% so far this week amid Charles Hoskinson's clarification that "break" isn't an exit. A reactionary spike in on-chain activity and social chatter, reflecting a strength of community, but fails to absorb the price decline.

Arthur Hayes' “Holy Trinity” is dead: Exits Zcash after Orchard Pool exploit

Arthur Hayes dumped his entire Zcash holdings on Friday, a day after selling his HYPE and NEAR holdings. Zcash is down 13% so far on Friday, extending the 26% drop from the previous day.

Billions in ETF outflows don’t bode well
Bitcoin (BTC) remains under pressure, trading below $74,000 on Friday, and is set to post its third consecutive week of losses. The institutional sell-off continues, with spot BTC Exchange-Traded funds (ETFs) recording billions in outflows. In addition, sticky inflation and macroeconomic headwinds suppress the Crypto King’s upside potential. Institutional demand continues to weaken so far this week.