Polkadot price keeps support structure, targets $32
- Polkadot price pushed to five-month and 2022 lows.
- DOT enters a supportive buy zone.
- Powerful bullish reversal pattern on the Point and Figure chart is now active.

Polkadot price has come a long way since its all-time high, trading nearly 61% below the all-time high in under three months. Unfortunately, this week’s price action added a considerable amount to that loss, with a drop nearing a 25% weekly loss. However, support is likely coming in soon.
Polkadot price creates a rare and powerful bullish reversal signal
Polkadot price has a very exciting and bullish development on its Point and Figure chart, despite the current bearish sentiment. In Point and Figure analysis, two primary patterns signal bearish extremes. The first is a bearish Spike Pattern – any column with fifteen or more Os. The second is a Bearish Shakeout.
A Bearish Shakeout pattern occurs at the beginning of an uptrend but initially acts as a short signal. The Bearish Shakeout requires a multiple-bottom followed by at least two, but no more than three Os below the multiple bottom. Polkadot price has fulfilled this pattern.
A phenomenal hypothetical long setup now exists with a buy stop order at $30, a stop loss at $22, and a profit target at $82. This trade represents a 6.5:1 reward/risk setup with an implied profit target of 200% from the entry. The probability of a profit target so far from the entry getting hit is low, but the range should give traders an idea of how expansive the move higher can be. A three-box trailing stop would protect, and profit made post entry.
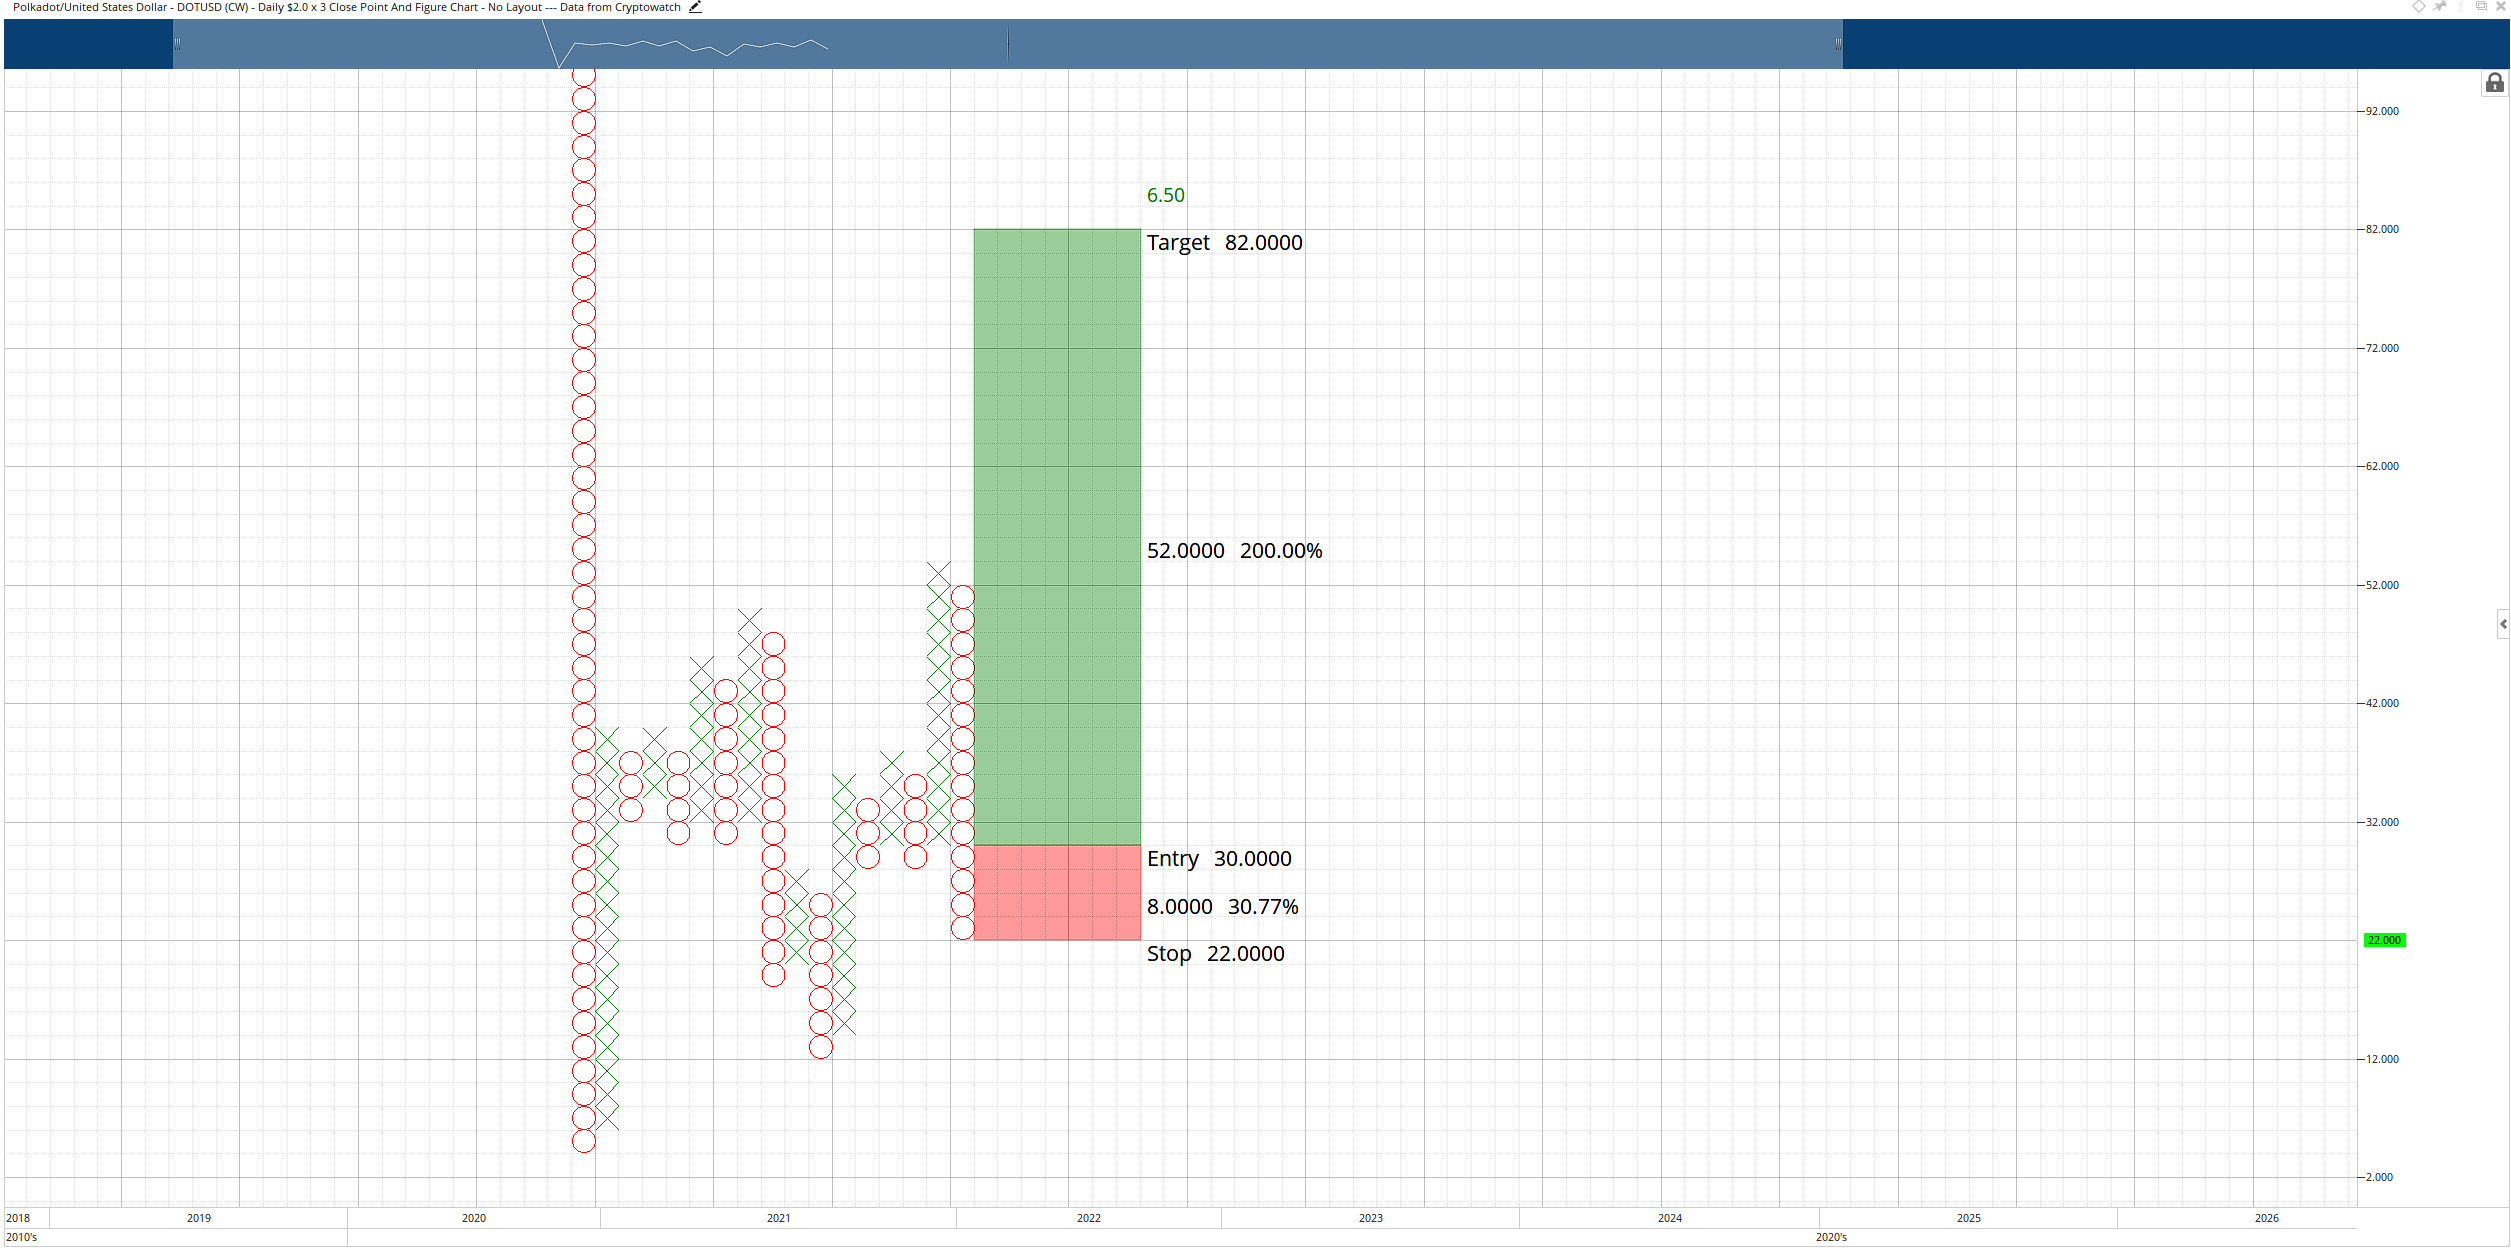
DOT/USDT $2.00/3-box Reversal Point and Figure Chart
There is no invalidation level for the buy entry on this hypothetical long setup. Because it is also a Spike Pattern, the entry is always on the three-box reversal no matter how low it moves.
Author

Jonathan Morgan
Independent Analyst
Jonathan has been working as an Independent future, forex, and cryptocurrency trader and analyst for 8 years. He also has been writing for the past 5 years.


