Polkadot price sets bear trap before DOT returns to $82
- Polkadot price develops a massive bullish reversal setup on its Point and Figure chart.
- A huge bear trap could trigger an explosive short squeeze.
- DOT awaits bulls to enter and begin the next major spike for Polkadot.

Polkadot price could be one of the earlier and biggest movers in any broader cryptocurrency return to bull market conditions. The setup on the $2.00/3-box reversal Point and Figure chart is an epic combination of bear traps.
Polkadot price positioned for a 175% move – if it can break above near term resistance
Polkadot price continues to face significant resistance in the low $30 price ranges. On the weekly Ichimoku chart, Polkadot must cross above the Volume Point Of Control at $28.50, the 38.2% at $31.00, the Tenkan-Sen at $33.00, and the Kijun-Sen at $34.25. Once DOT closes above those levels, it’s a wide-open space bereft of any resistance.
The $2.00/3-box reversal Point and Figure chart shows one of the most potent collections of bearish rejection in the cryptocurrency space. If the theoretical entry zone is triggered, then the following conditions are confirmed:
- Failed triple-bottom breakout – A triple-bottom break has a high positive expectancy rate of becoming a profitable setup. The entry would deny that setup and trap a significant number of short-sellers hoping to capitalize on this very bearish pattern.
- Bearish Fakeout Pattern confirmed – The bearish fakeout occurs when an instrument moves one to two (no more than three) boxes below a multiple-bottom, but then a reversal column of X’s forms and generates a buy entry.
- Spike Pattern confirmed – a Spike Pattern is a long column of X’s or O’s representing excess in a market move; they are aggressive reversal patterns that can terminate trends.
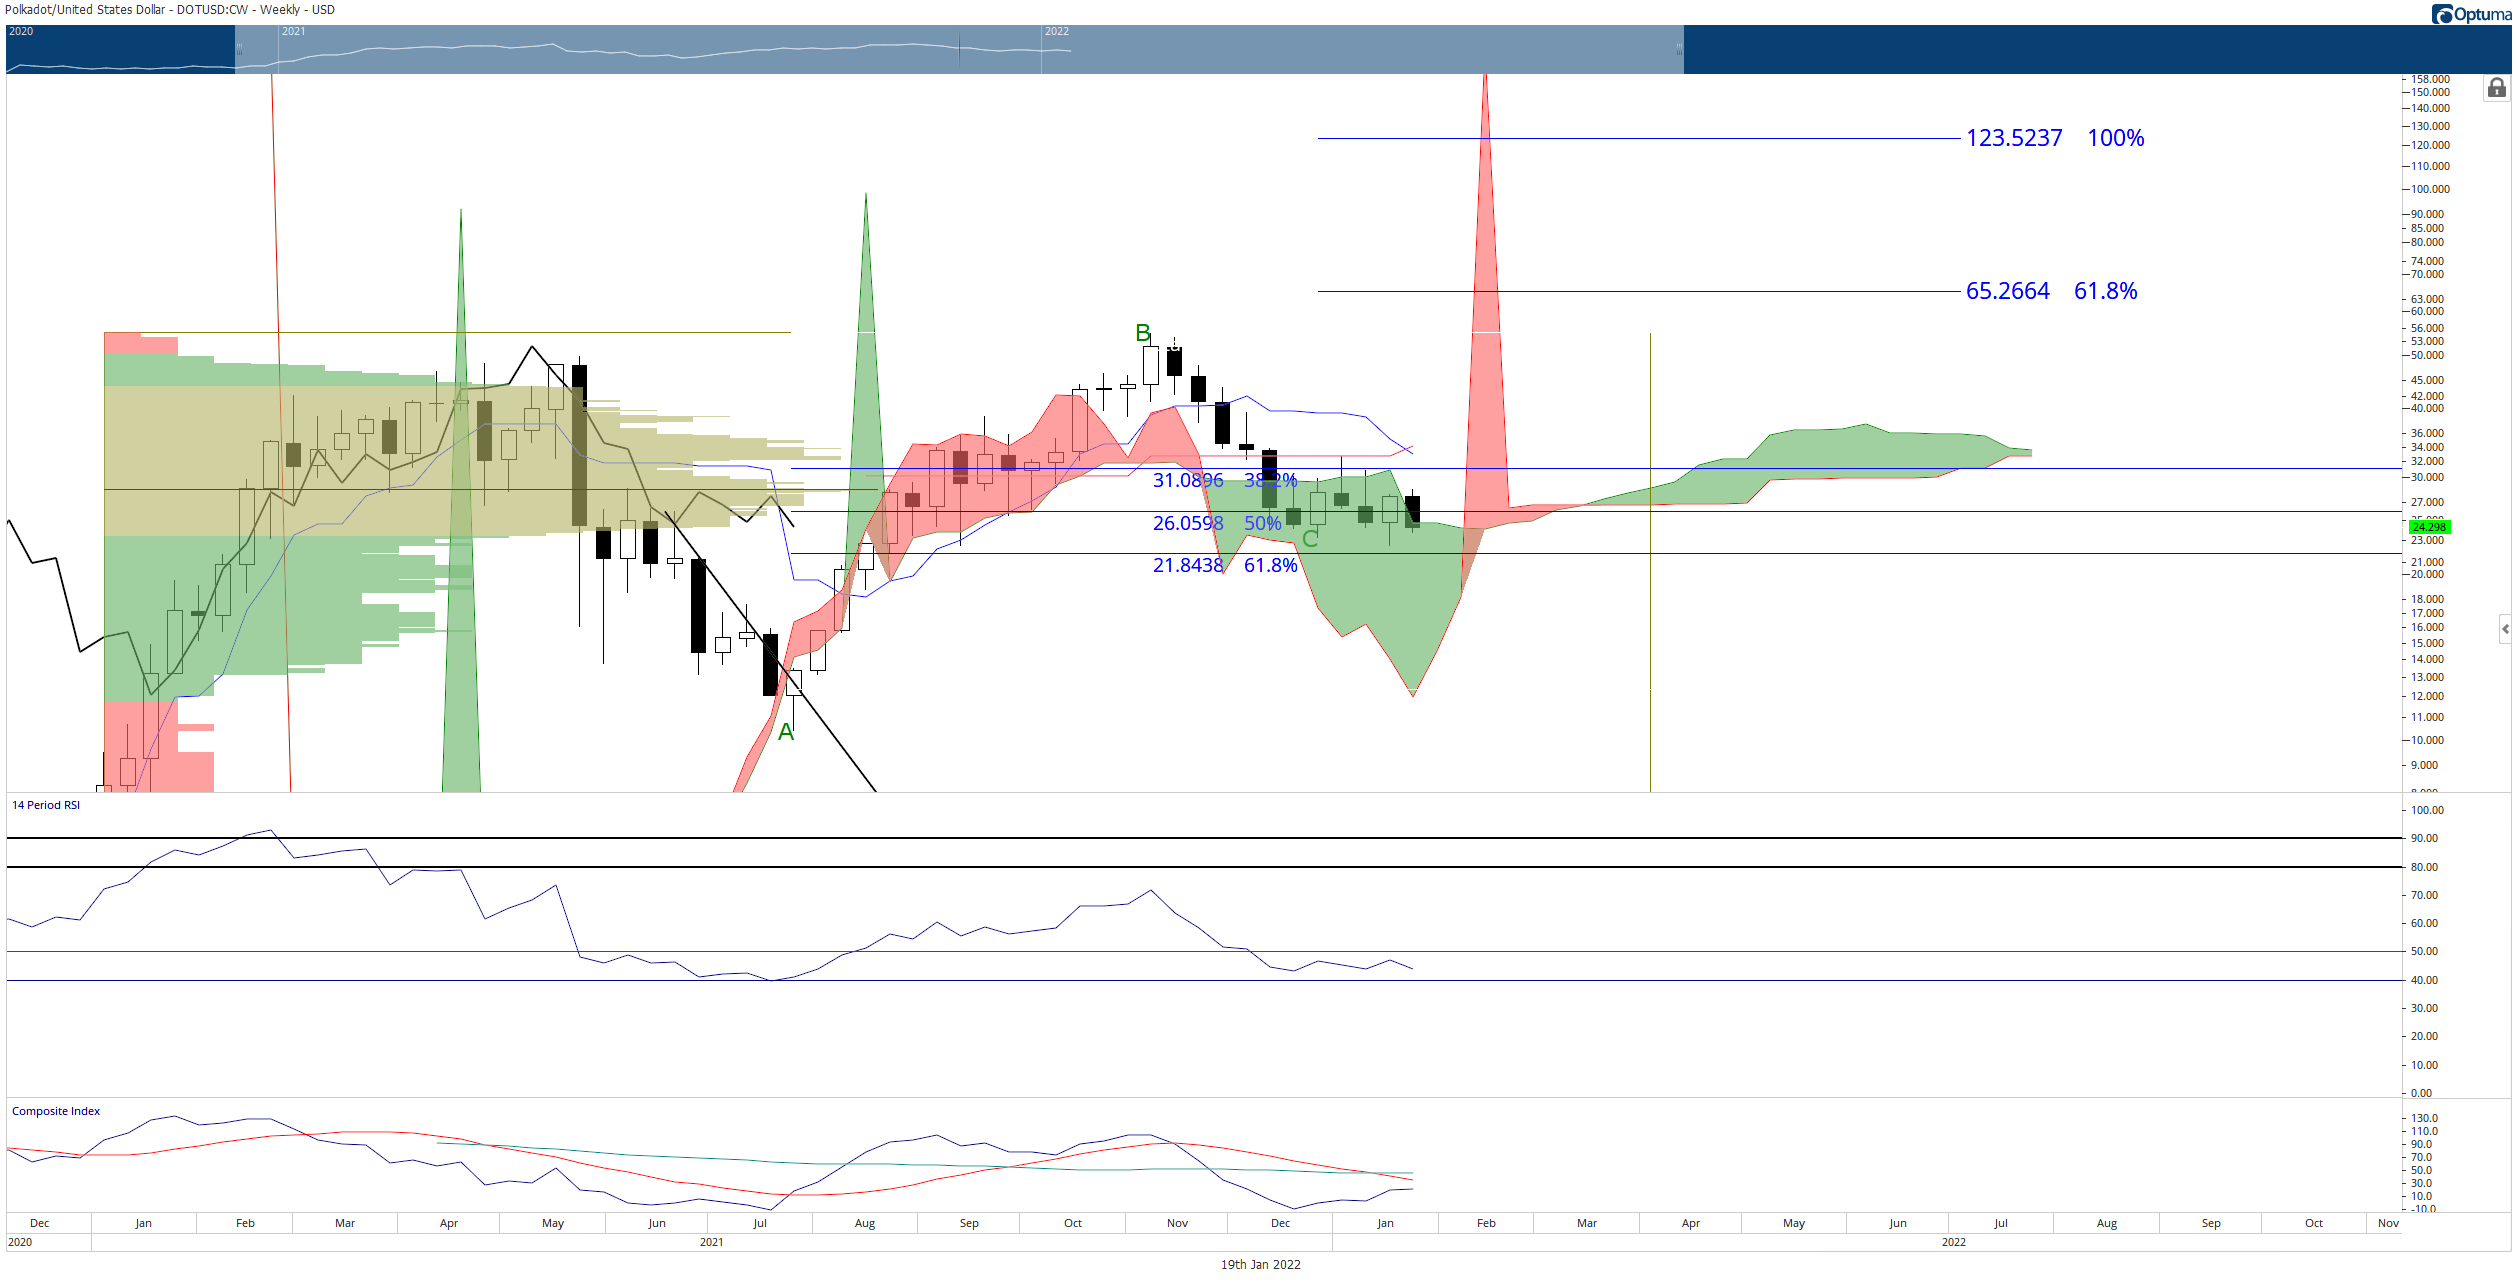
DOT/USDT Weekly Ichimoku Kinko Hyo Chart
Typically, in a Bearish Fakeout Pattern, the entry wouldn’t occur until the new X-column move above another multiple top. But because the Spike Pattern is confirmed, the Spike Pattern’s entry fulfills the entry and completion of the Bearish Fakeout.
The theoretical long entry is a buy stop order for Polkadot price at $32, a stop loss at $24, and a profit target at $82. This trade represents a 6.25:1 reward/risk with an implied profit target of 178%. However, the probability of Polkadot price hitting $82 immediately or in a short period of time is not likely. Therefore, a three-box trailing stop would help protect any profit made post entry.
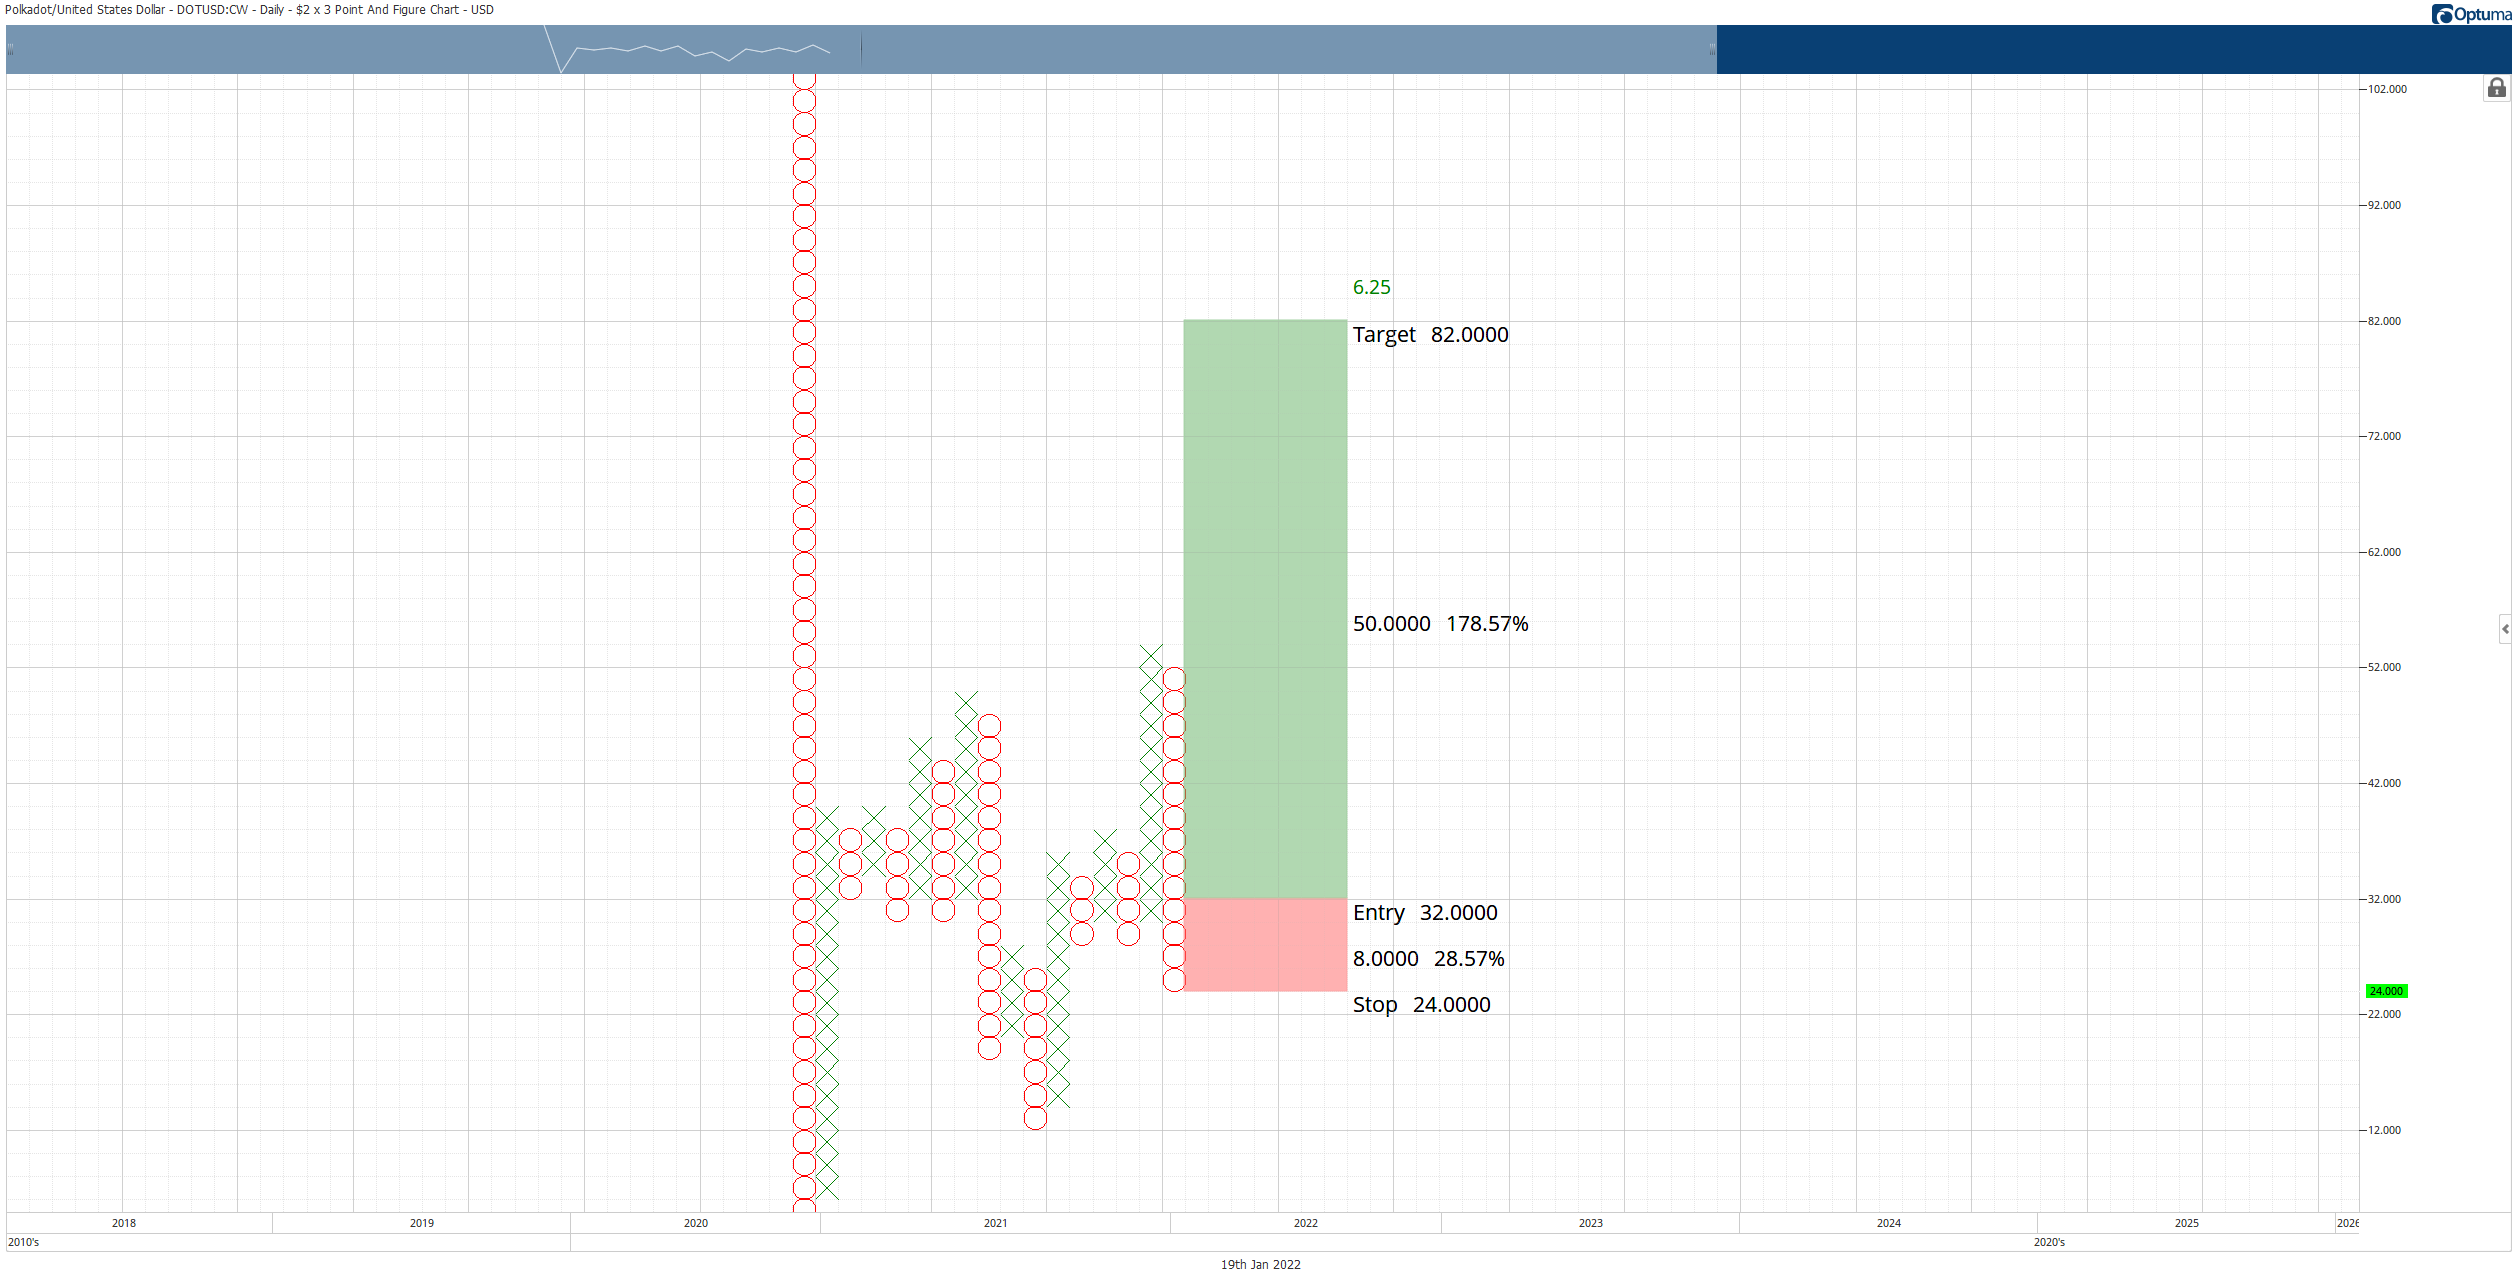
DOT/USDT $2.00/3-box Reversal Point and Figure Chart
The theoretical long entry for Polkadot price is invalidated if the current O-column moves below the $20 value area.
Author

Jonathan Morgan
Independent Analyst
Jonathan has been working as an Independent future, forex, and cryptocurrency trader and analyst for 8 years. He also has been writing for the past 5 years.


