Polkadot price to present buying opportunity before 35% breakout
- Polkadot's price action attempted to break above $30 but stopped in its tracks.
- DOT price action is now on the back foot again, with investors waiting for the right moment to re-enter.
- The green ascending trend line that currently comes in around $22.50 would be a perfect entry point for a bounce towards $30.

Polkadot price is retreading water as bulls cannot defend $25.19, and price returns to the lower levels of 2022. Investors have no incentive for the moment for any aggressive entries as global market sentiment is weighing on price action. Expect investors to hold for both a shift in sentiment and a test on the longer-term green ascending trend line that currently quotes around $22.36 before popping back up towards $30.
Polkadot price action needs to give a little to gain big
Polkadot price had issues reaching $30 as bulls were stopped in their tracks even before hitting $29.12, a less critical resistance level. Since then bears have used the turn in market sentiment to risk-off, to enter DOT price and run prices to the downside. But bulls are not far away and are patiently watching to enter – possibly at the green ascending trend line – for a bounce.
That longer-term green ascending trend line has proven its importance in the past on multiple occasions throughout 2021. Even a break below it would not be so bad, as around $20.51 support kicks in from a historical support level and the monthly S1 support level. These comprise two solid entry levels for bulls to engage in price action to be part of the market when sentiment reverts to risk on and pushes higher.
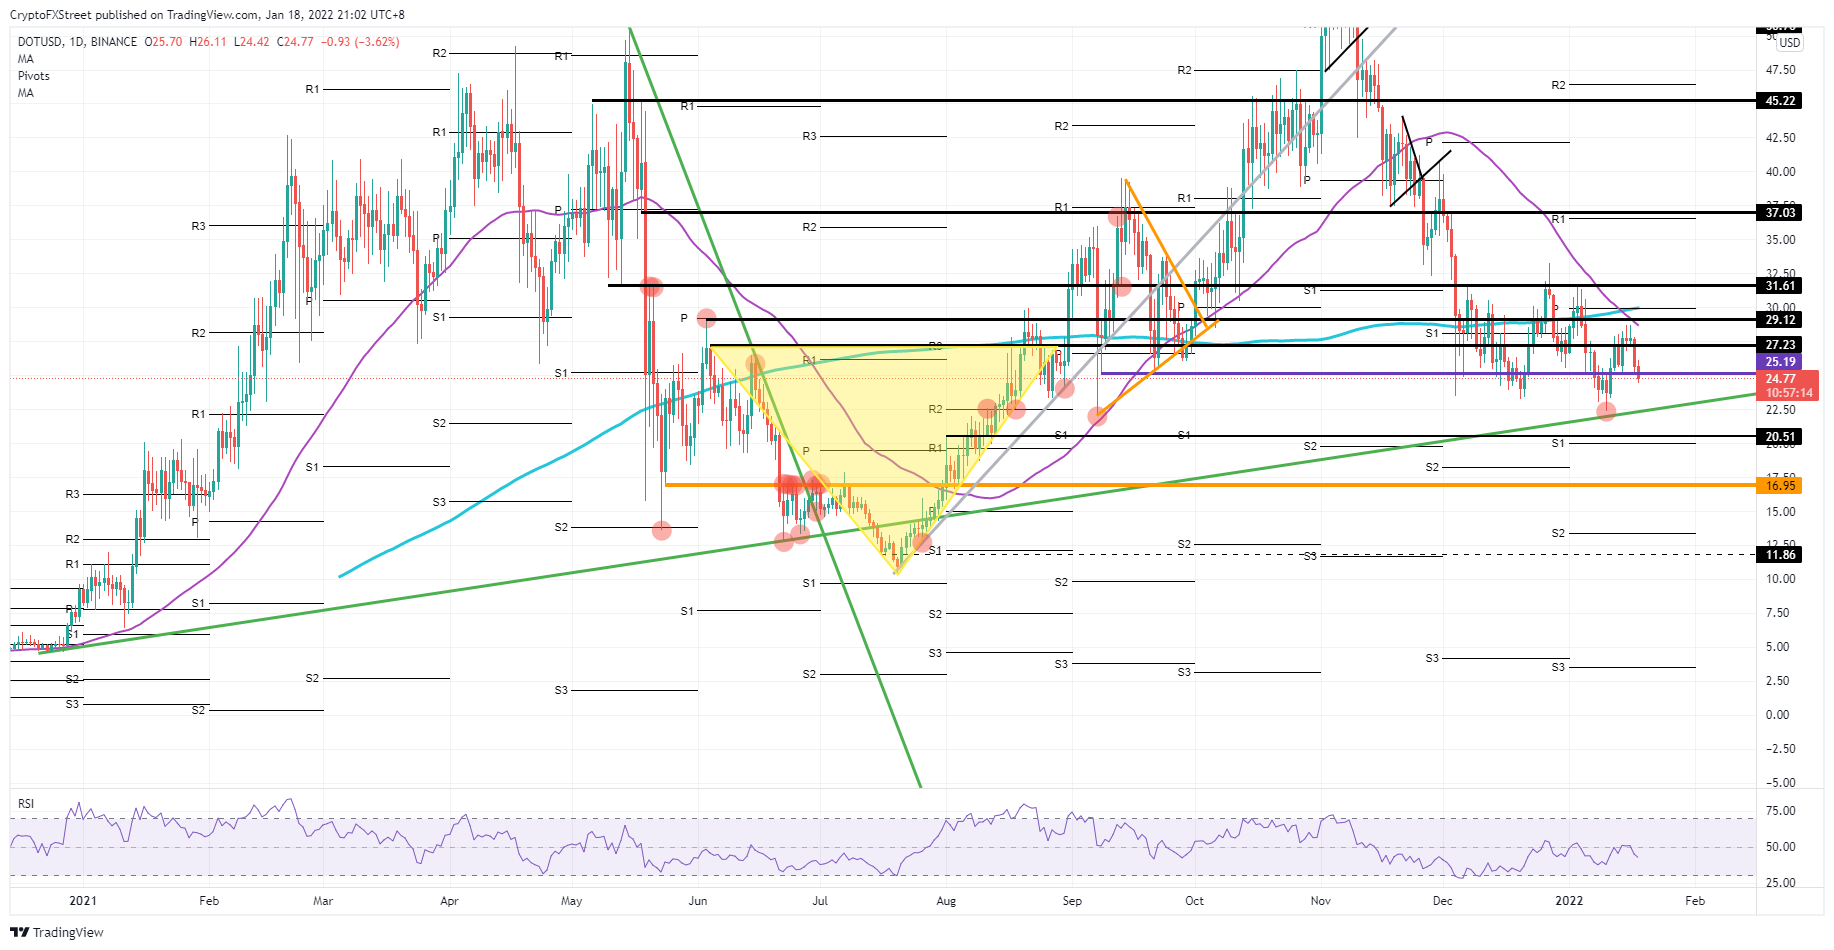
DOT/USD daily chart
Although markets are on the back foot, long equities and risk-on are looming beneath the surface and could quickly emerge. This would add to tailwinds in cryptocurrencies and see a quick reversal in price action. This time expect the $30 to be tested, as the monthly pivot and the 200-day Simple Moving Average will trigger profit-taking. With the uptick, the 55-day SMA could be crossing back above the 200-day SMA, making it a golden cross, a strong signal of more upside for traders, which could ramp up price action even more, towards $37.
Author

Filip Lagaart
FXStreet
Filip Lagaart is a former sales/trader with over 15 years of financial markets expertise under its belt.


