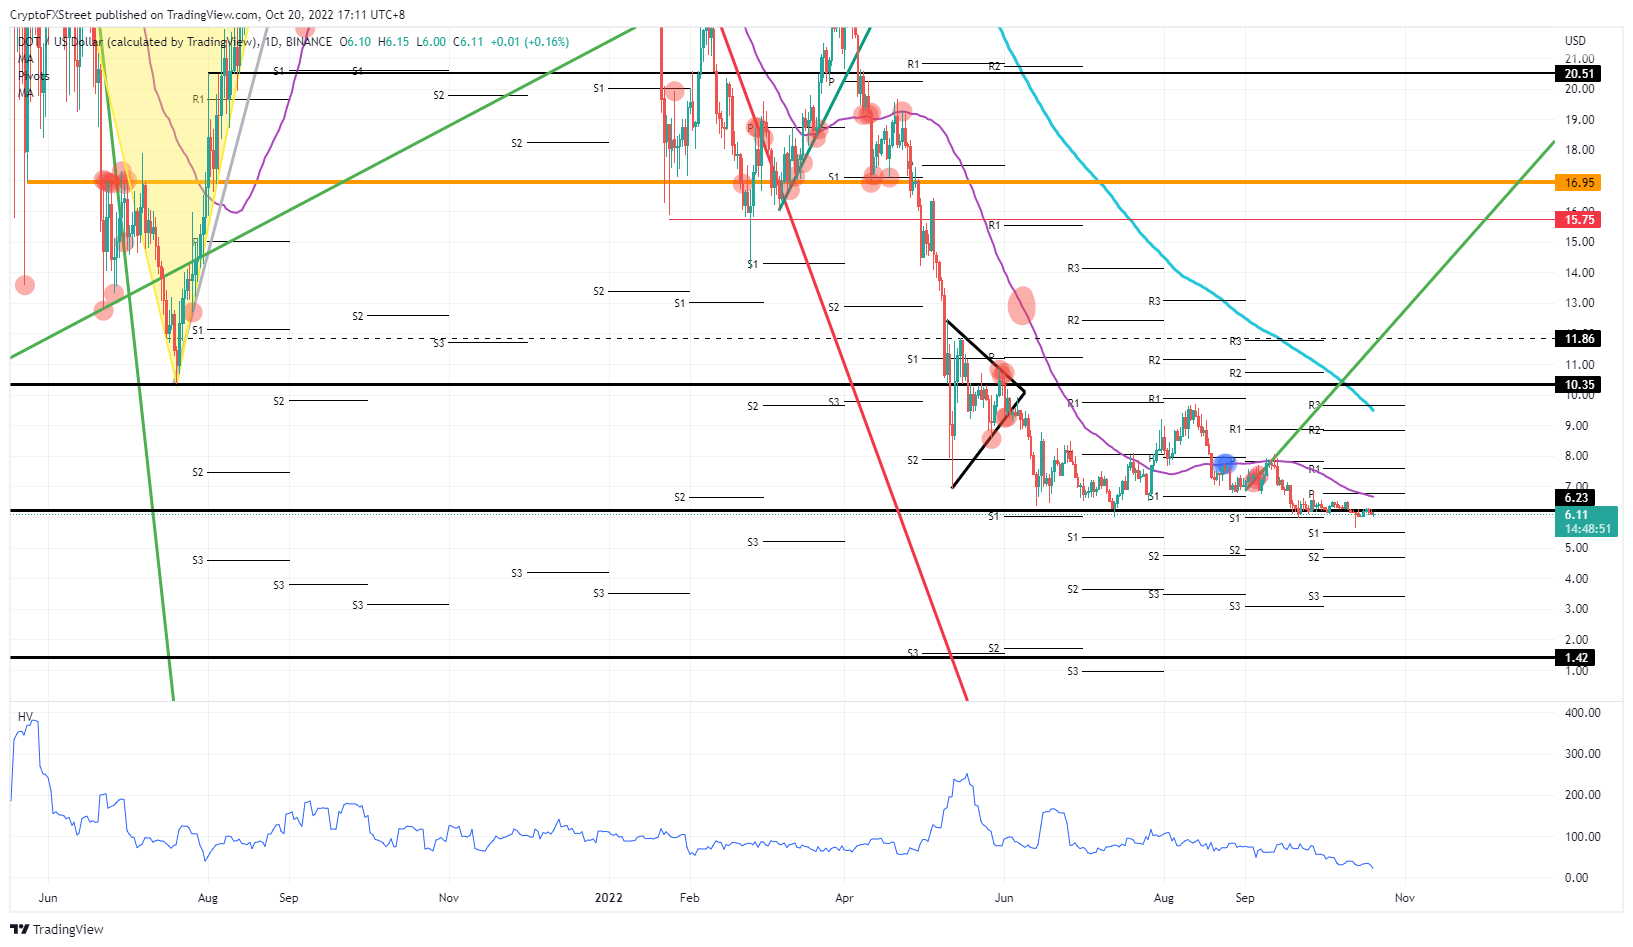
Polkadot price is showing abnormal behaviour as volatility is at an all-time low.
- Polkadot price action is trading in abnormally tight ranges.
- DOT price action is long overdue a breakout as the squeezes are getting to the narrowest point ever.
- The longer this continues, the bigger the risk of a massive imbalance followed by a sharp move lower to $1.42.

Polkadot (DOT) price action looks almost reluctant to react to any market news or events and neither bulls nor bears are willing to enter massive orders. This stands in contrast to other cryptocurrencies that are very sensitive to the current elements moving markets, ranging from geopolitics to central banks and economic data releases. This insensitiveness could be pointing to a massive move on the horizon, however, as one side eventually gets the upper hand and drives the direction.
Is the DOT price set to implode?
Polkadot price action has been trading in a very narrow range with very limited upside and downside for over a month. This is reflected in the Historic Volatility bar below the graph, where it is visible that volatility has hit an all-time low. It almost looks like Polkadot price action is insensitive to any of the waves and shocks that have hit markets recently. This could point to a risk that buyers or sellers will soon exit their positions, creating an imbalance that will trigger a price correction.
DOT price is thus set to tank sharply or even implode should bulls decide to exit, especially given the current global economic backdrop. That would mean a massive cash departure, and the market cap for DOT price action cut in half. On the charts, that would be translated into a nosedive move toward either $3.00, with the three-monthly supportive pivots coming in to slow down the plunging elevator – or the historical low at $1.42 as the end of the line in this decline.
DOT/USD Daily chart
From a bullish perspective, the biggest reference to determine whether an uptick could be the beginning of a rally comes with a break above the 55-day Simple Moving Average near $7. Seeing its importance since August, it is the best barometer on when to enter long positions. Once the rally starts, expect it to stretch as far as $9.50 with the monthly R3 resistance and the 200-day SMA coming in as caps on the topside.
Author

Filip Lagaart
FXStreet
Filip Lagaart is a former sales/trader with over 15 years of financial markets expertise under its belt.


