Polkadot price shows bullish signs, but a retest of $6.85 is still far away
- Polkadot price has severed its downtrend by triggering a breakout above the declining trend line.
- A bullish divergence suggests a further upswing that could push DOT to retest the immediate resistance level at $6.85.
- A daily candlestick close below $6.00 could prevent a bullish scenario from taking place.

Polkadot price seems to be cooking up a bullish move from a technical perspective, but the general market conditions are not ripe. Therefore, investors need to be careful in making their moves based on technicals alone.
Polkadot price gears up
Polkadot price has produced three lower highs since August 10, shedding roughly 36%. As DOT trades at $6.25, the technicals seem to be improving quite a bit.
The first sign is the breakout above the declining trend line connecting these lower highs formed since August 10. Furthermore, Polkadot price seems to have also produced a higher low relative to the September 21 swing low at $6.12.
In this same period, the Relative Strength Index (RSI) has set up higher lows, indicating a divergence between the price and the indicator. Since the momentum is rising, this formation is termed as ‘bullish divergence.’
The said pattern results in a bullish move for the underlying asset. Therefore, the technicals for Polkadot price hint at an incoming rally. The immediate resistance level at $6.85 is the best candidate, but investors need to be cautious as a selloff in Bitcoin price could delay this move from DOT.
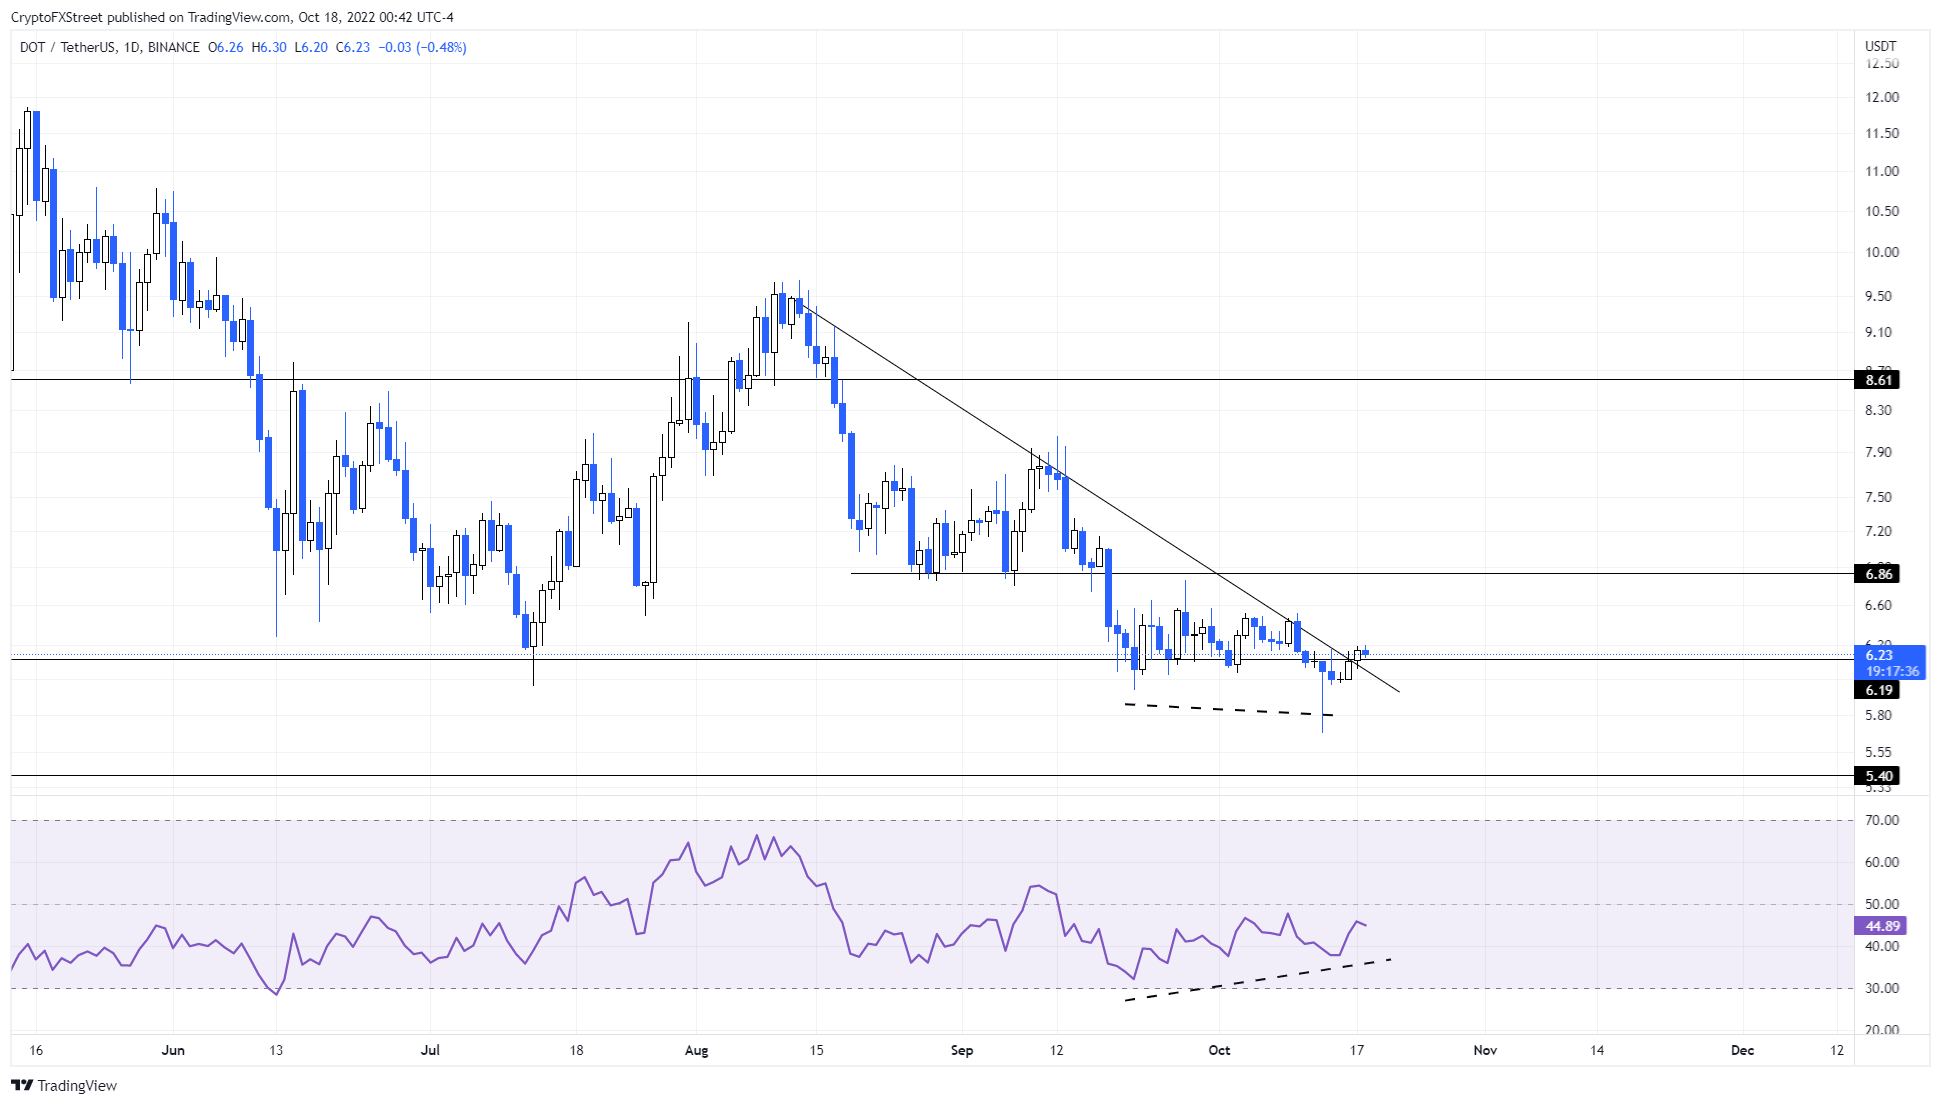
DOT/USDT 1-day chart
While things are looking up for Polkadot price, a breakdown of the $6.00 psychological level will indicate the shift in narrative favoring the bears. In such a case, market participants can expect DOT to retest the $5.40 support level.
Note:
The video attached below talks about Bitcoin price and its potential outlook, however, this is still relevant as it is likely to influence Polkadot price.
Author

Akash Girimath
FXStreet
Akash Girimath is a Mechanical Engineer interested in the chaos of the financial markets. Trying to make sense of this convoluted yet fascinating space, he switched his engineering job to become a crypto reporter and analyst.


