Polkadot price forms Golden Cross as DOT signals 48% gains
- Polkadot price action has been kind to bulls in October with already 36$ of gains.
- A Golden Cross was formed at the end of September after cutting previous losses.
- The 55-day SMA falls in line with the orange ascending trend line from September 7 and forms a double engine in the DOT bull rally.

Polkadot price (DOT) has seen the favor of the market amidst a global rebound in love for cryptocurrencies. With Bitcoin back above $50,000, alt currencies are seeing more inflows and gains across the board. As DOT price action is paring back losses from September, more gains are in the cards as bullish signals and indicators empower DOT.
DOT price action sees bullish signals flashing all over
Polkadot price has been busy reversing losses that occurred in September. DOT's price action is back above $30 and is looking bullish with promising technical indicators across the board. The bullish trend comes from the orange ascending trend line that originated on September 7. With a few false breakouts, it holds its importance and has supported bulls in ramping price action back up toward $36.
With the favorable tailwind hovering over cryptocurrencies and Bitcoin on the front foot, a Golden Cross has been formed between the 55-day and 200-day Simple Moving Average (SMA). That 55-day SMA also moves just above the orange ascending trend line. This demonstrates that a bullish squeeze is unfolding in DOT price action.
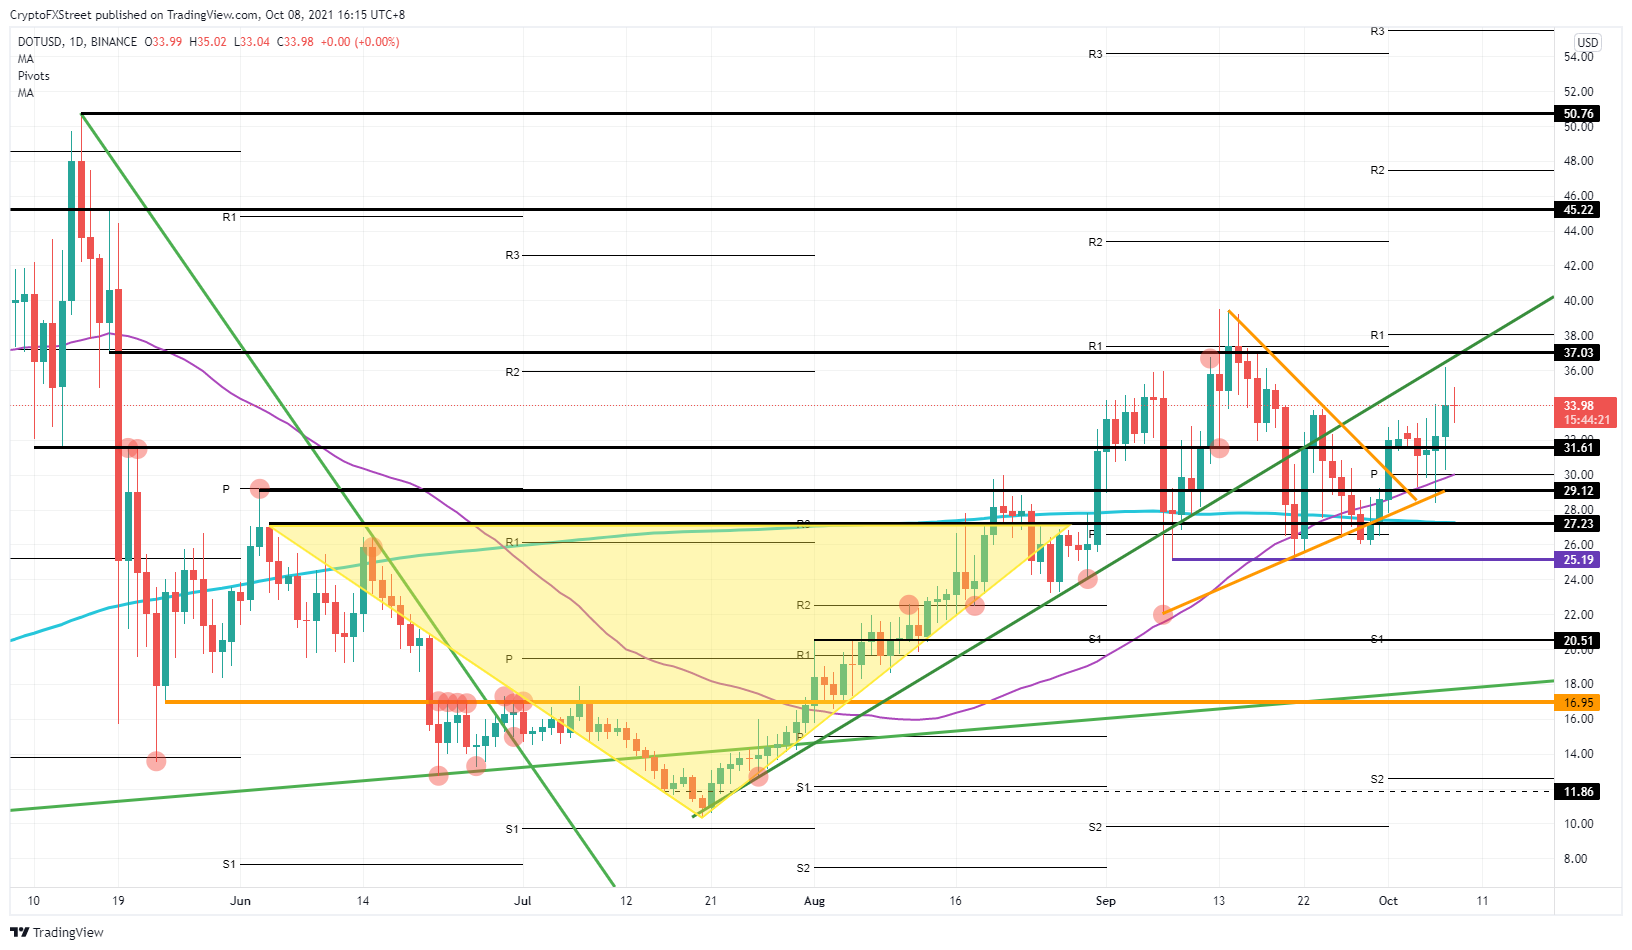
DOT/USD daily chart
Expect price action in Polkadot to get brushed against $37, with the monthly R1 resistance level and historical level from May 18 as resistance. A breakout would target $45.22 as the next port of call for profit-taking, but that will only be an intermediary. The ultimate price target for bulls is $50.76, with the psychological $50 level and the high from May 15.
If the positive tailwind should come to a halt, expect price action to stall between $30 and $37. Should global markets dip lower and switch to risk-off, expect a return toward $25. With bears possibly going in for the kill, expect an attempt to sell off further toward $20.51.
Author

Filip Lagaart
FXStreet
Filip Lagaart is a former sales/trader with over 15 years of financial markets expertise under its belt.


