Polkadot Price Forecast: DOT extends consolidation with focus on new highs
- Polkadot price responding positively to the convergence of two tactically important support levels.
- DOT fails to close with a bullish engulfing week, temporarily breaking upside momentum.
- Topside trend line remains the big obstacle for bullish investors in the short term.

Polkadot price is respecting support and could be on pace to close the day with a bullish hammer candlestick pattern. A few hours remain until the close, but it would be an important development in DOT’s quest to overcome the persistent resistance.
Polkadot price tries to challenge constant selling pressure
2021 began strongly for DOT as Polkadot price rallied over 700% into the February high, securing its position as one of the largest cryptocurrencies. However, since the February 20 high at $42.70, the DeFi coin has only rallied another 20% into the May 15 high at $50.74.
Since February, the slight uptrend has created a consolidation range with a stubborn topside trend line and a bearish momentum divergence on the daily Relative Strength Index (RSI), as the index has not printed a new high with DOT price in April or this month.
However, it is important not to overlook the potential of the 12-week consolidation in DOT. The six-week consolidation in MATIC recently yielded a 300% return in just three weeks. In the case of the nine-week consolidation for ADA, it produced a 60% move in less than two weeks.
DOT failed to close last week with a bullish engulfing week on the bar charts, punishing over-eager investors. It would have been a rare and powerful development for the emerging rally off the April low. Instead, Polkadot price closed with a doji candlestick pattern signifying a high level of indecision among buyers and sellers.
Today, Polkadot price is wrestling with support introduced by the convergence of the declining 50-day simple moving average (SMA) and the daily Ichimoku Cloud. If DOT can keep daily closes around the range of the two tactically important trend indicators, it raises the odds that a test of the topside trend line is near.
Resistance begins at the trend line at $52.10. A successful breakout leaves Polkadot price primed to test the 161.8 Fibonacci extension at $63.63 and the 261.8% extension at $87.00, generating a 67% from the trend line and over 100% gain from price at the time of writing ($39.55).
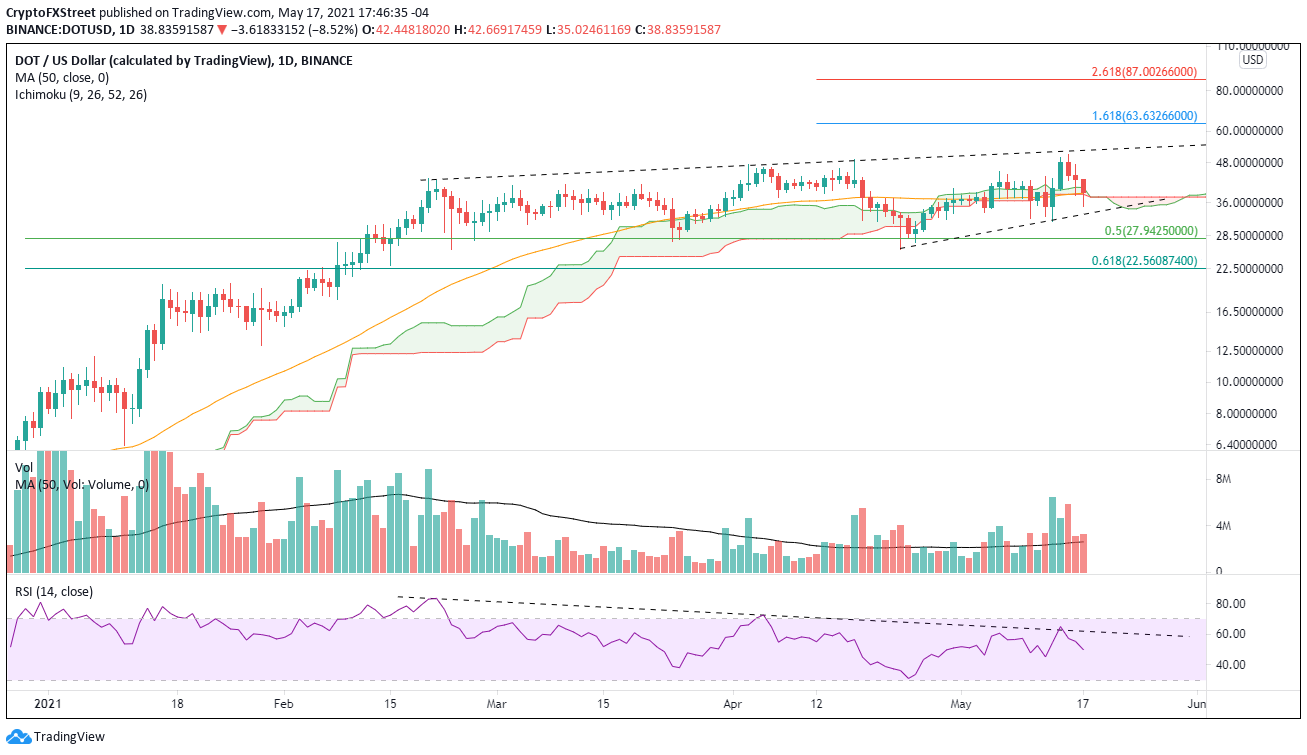
DOT/USD daily chart
A daily close below the minor trend line at $32.92 would cue a more significant decline through the May 13 low at $31.60 and to the 50% retracement of the 2021 rally at $27.94. Residual selling pressure could push Polkadot price to test the April low at $25.82.
Author

Sheldon McIntyre, CMT
Independent Analyst
Sheldon has 24 years of investment experience holding various positions in companies based in the United States and Chile. His core competencies include BRIC and G-10 equity markets, swing and position trading and technical analysis.


