Polkadot price expels weak holders, prepares DOT for a 60% rally
- Polkadot price is on course to close this week with a bullish engulfing week.
- Downtrend for the weekly Relative Strength Index (RSI) retreats.
- DOT topside trend line may offer temporary resistance for the new rally.

Polkadot price is preparing to finalize the end of a multi-week consolidation beginning with a rare but powerful, bullish engulfing week. If DOT remains above last week’s high at $44.99 through the weekend, it will confirm a new uptrend for the 8th largest cryptocurrency by market capitalization.
Polkadot price to reward patient altcoin investors
It was an eventful beginning to 2021, as Polkadot price rallied over 700% into the February high, securing its position as one of the largest cryptocurrencies. Since, price action has been mixed and sideways, with brief new highs in April failing to galvanize investor enthusiasm.
A couple of weeks ago, it appeared that Polkadot price was beginning to shape the right shoulder of a massive head-and-shoulders top, but this week’s price surge has disrupted the pattern symmetry and forced a rethink of the outlook.
If Polkadot price does close the weekend above $44.99, thereby triggering a bullish engulfing week, it will raise the odds that DOT will pierce the topside trend line, leaving the altcoin free to touch much higher prices.
A bullish engulfing week is formed when the current week’s price low undercuts the previous week’s low and reverses higher to close above the last week’s high. It signals that the remaining weak and impatient DOT holders have been expelled, and the digital token’s investor base is being populated by investors that are more committed.
It is important not to underestimate the power of long-duration consolidations like the one for DOT. Two examples are the MATIC breakout at the end of April from a six-week consolidation that has earned a 200% for investors and the Cardano breakout this month from a nine-week consolidation that has rewarded investors with a gain of over 30%.
Moving forward, Polkadot price needs a weekly close above $44.99 on Sunday to activate the bullish thesis. The first resistance is the topside trend line at $53.72 and then the 161.8% Fibonacci extension of the April correction at $63.63. Bigger aspirations will target the 261.8% extension of the April correction at $87.00, generating a 60% return from the topside trend line.
It is important not to underestimate the power of long-duration consolidations like the one for DOT. Two examples are the MATIC breakout at the end of April from a six-week consolidation that has earned a 200% for investors and the Cardano breakout this month from a nine-week consolidation that has rewarded investors with a gain of over 30%.
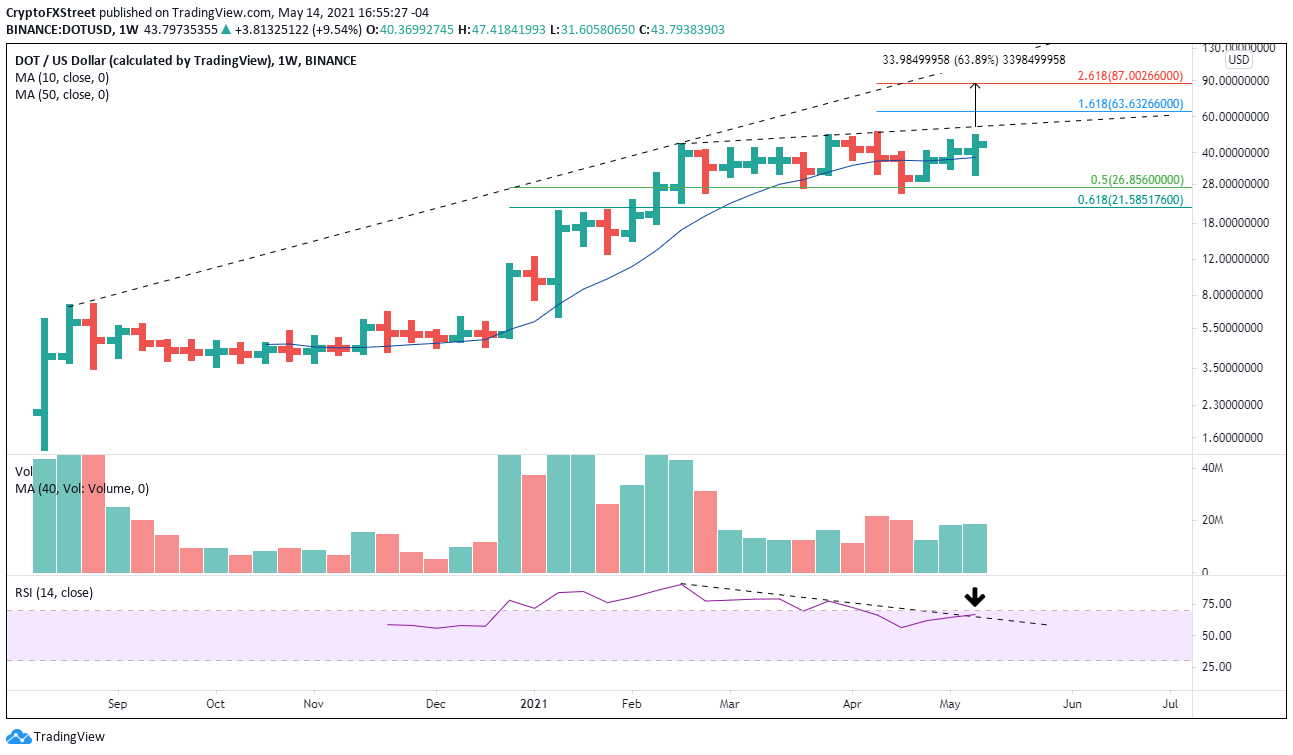
DOT/USD weekly chart
Polkadot price could ruin the outlook by closing below $44.99 on Sunday. Initial support will materialize at the tactically important 10-week simple moving average at $37.95. A spike in selling pressure will put the 50% retracement of the 2021 rally at $26.85 on the radar, a level that offered support twice during the consolidation.
Author

Sheldon McIntyre, CMT
Independent Analyst
Sheldon has 24 years of investment experience holding various positions in companies based in the United States and Chile. His core competencies include BRIC and G-10 equity markets, swing and position trading and technical analysis.



