Polkadot price finds stable support that may help DOT resume bull run
- Polkadot price finds buyers at a primary support zone.
- A three-week correction cycle is complete and resumption of the bull market likely.
- New all-time highs are in sight.

Polkadot price has a very healthy-looking weekly Ichimoku chart, showing significant support. Compared to its peers, Polkadot price faces limited downside risks.
Polkadot price bounces, a renewed push towards $70 likely
Polkadot price recently ended a strong sell-off triggered by a powerful cycle in Gann analysis known as Gann’s ‘death cycle.’ The ‘death cycle’ is a seven-week (49 to 52 day) cycle that Gann warned could terminate any move that showed persistent price movement at a high slope. Additionally, a three-week correction after the ‘death cycle’ is the most common reversion period.
Polkadot is trading against the most powerful support level combination possible on its weekly chart. The 2021 Volume Point Of Control and the weekly Kijun-Sen share the $33.50 value area, which is exactly where Polkadot has bounced. To now confirm a resumption of the prior uptrend, Polkadot price will need to return to and close above the weekly Tenkan-Sen at $42.00.
The Relative Strength Index shows some initial support against the first oversold level in the bull market (50). If 50 holds, then a bottom may be in for Polkadot. Additionally, the Composite Index has generated hidden bullish divergence – a condition that is often a precursor to a resumption of a prior bull market.
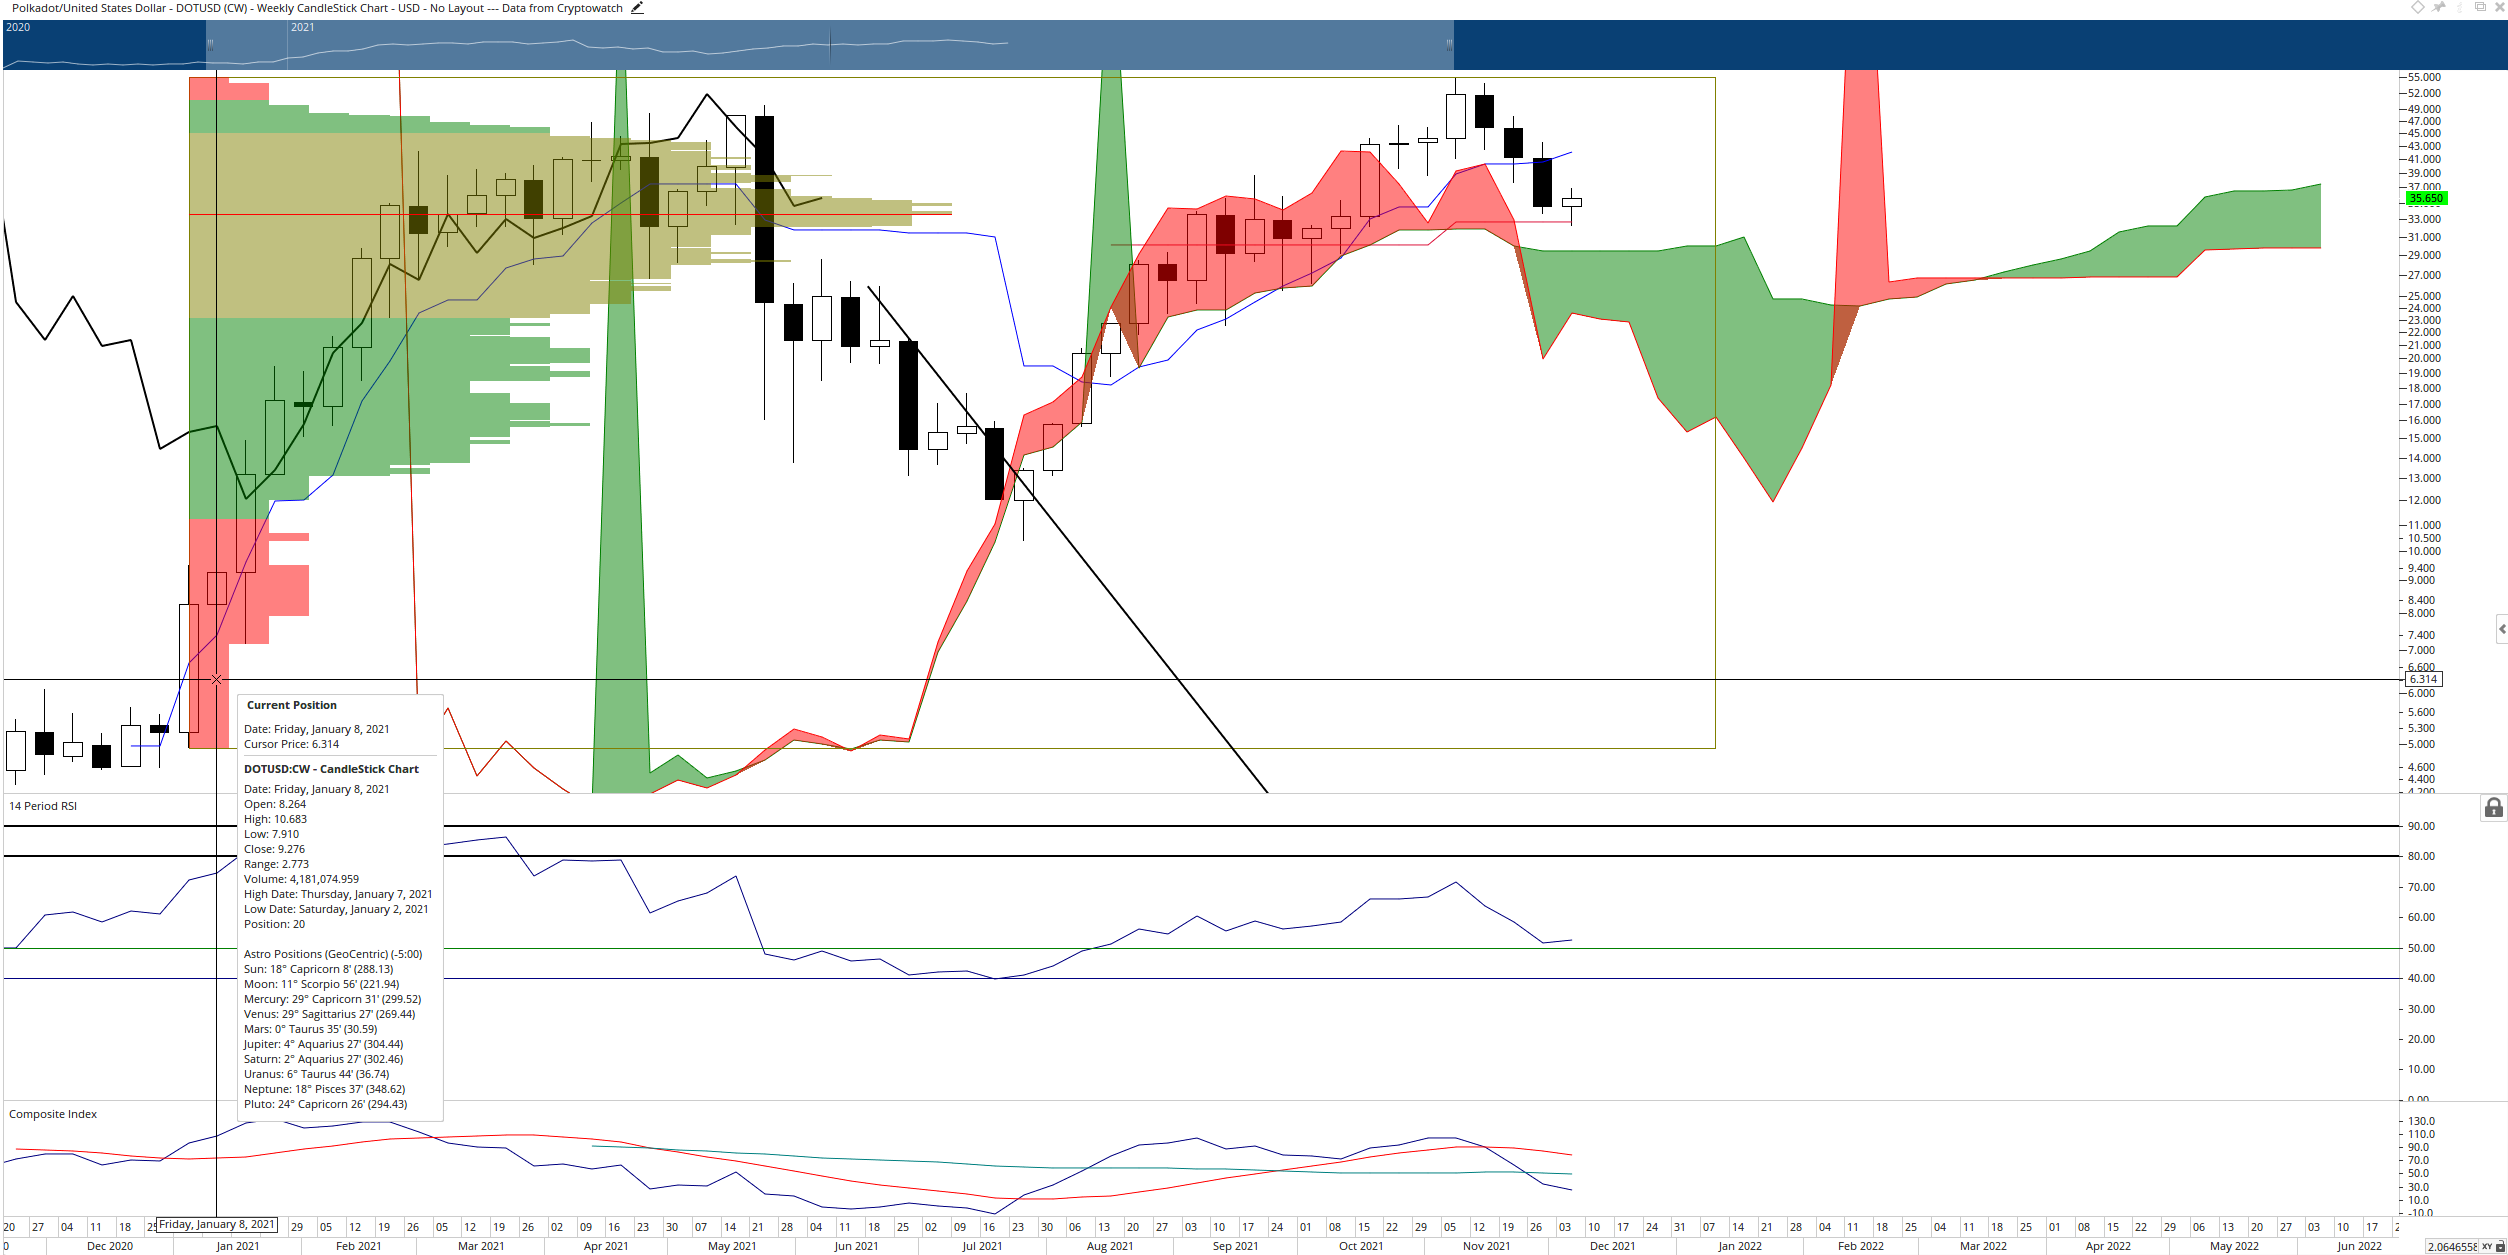
DOT/USDT Weekly Ichimoku Chart
Downside pressure and risks remain for Polkadot price, however. If the $33.50 value area fails as support, the next support zone to watch is the top of the Cloud (Senkou Span A) at $29.50. Any daily or weekly close below $29.50 could trigger faster and deeper selling pressure because the Volume Profile becomes thinner, the lower price moves. In other words, the lower Polkadot price moves below $29.50, the faster and easier it is for it to make further declines.
Author

Jonathan Morgan
Independent Analyst
Jonathan has been working as an Independent future, forex, and cryptocurrency trader and analyst for 8 years. He also has been writing for the past 5 years.


