|

Polkadot price can quickly hit $24 if bulls crack this crucial resistance level

  • Polkadot price hit a new all-time high at $21.73 on February 4.
  • The digital asset has a lot of bullish momentum behind it and aims for $24.
  • Only one crucial resistance level separates Polkadot from a new all-time high.

Polkadot price continues surging higher as the digital asset reaches $19 billion in market capitalization, on the verge of passing XRP. Despite the massive bull rally, it seems that DOT can see a new all-time high as there is only one crucial barrier ahead.

Polkadot price aims for $24 if bulls can crack this resistance level

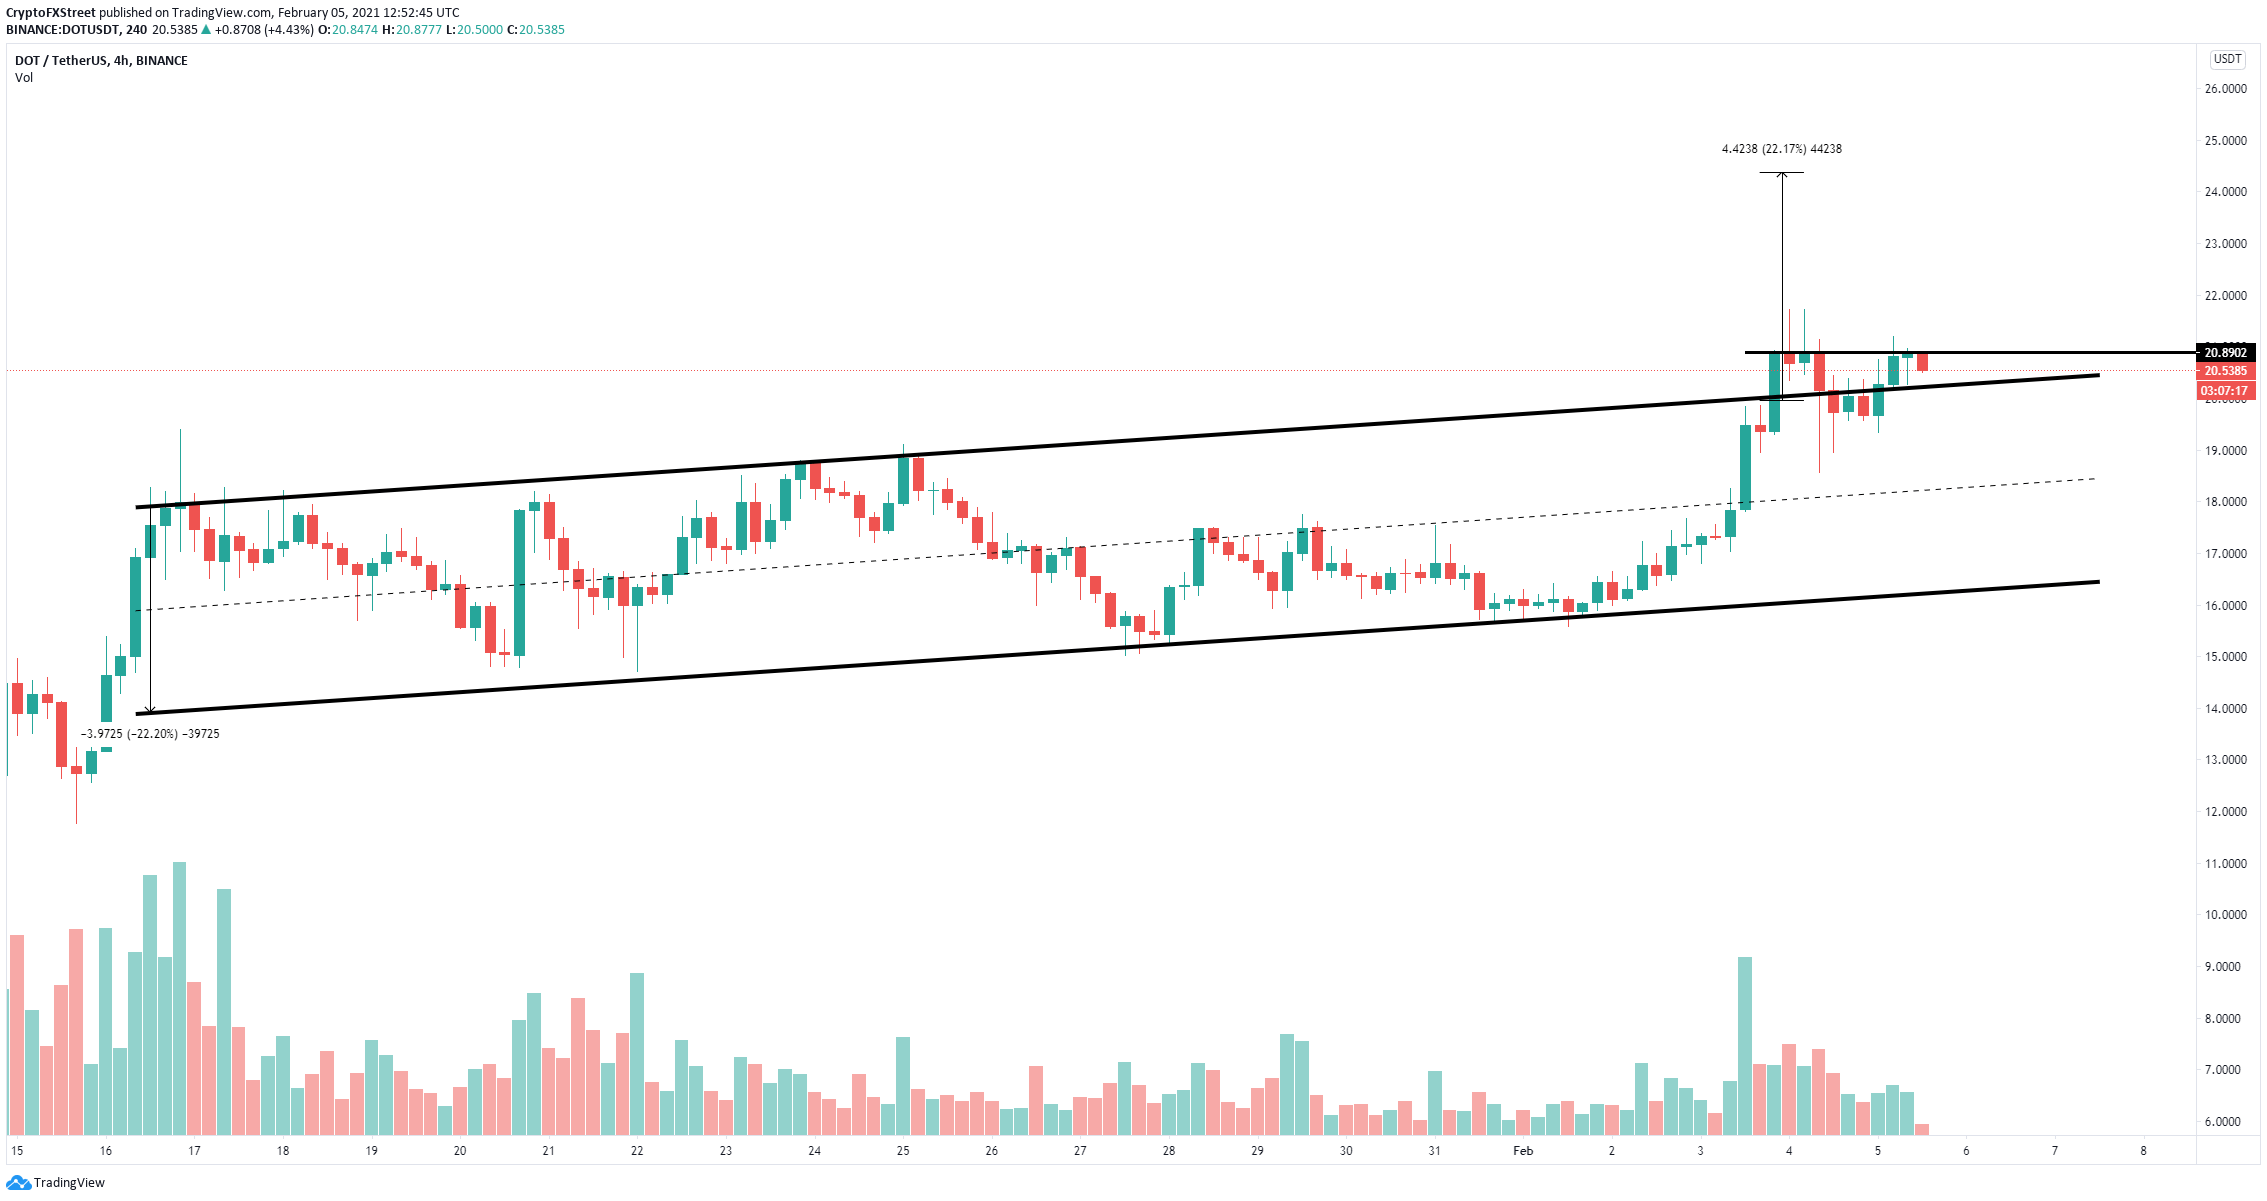
On the 4-hour chart, Polkadot price was trading inside an ascending parallel channel from which it broke out on February 3. The digital asset had a significant pullback to re-test the previous resistance level and has rebounded.
dot price

DOT/USD 4-hour chart

A critical resistance level has formed at $20.9 and has been tested several times in the past three days. A breakout above this point should drive Polkadot price towards the previous target of $24, which was calculated using the height of the parallel channel.
dot price

DOT/USD 1-hour chart

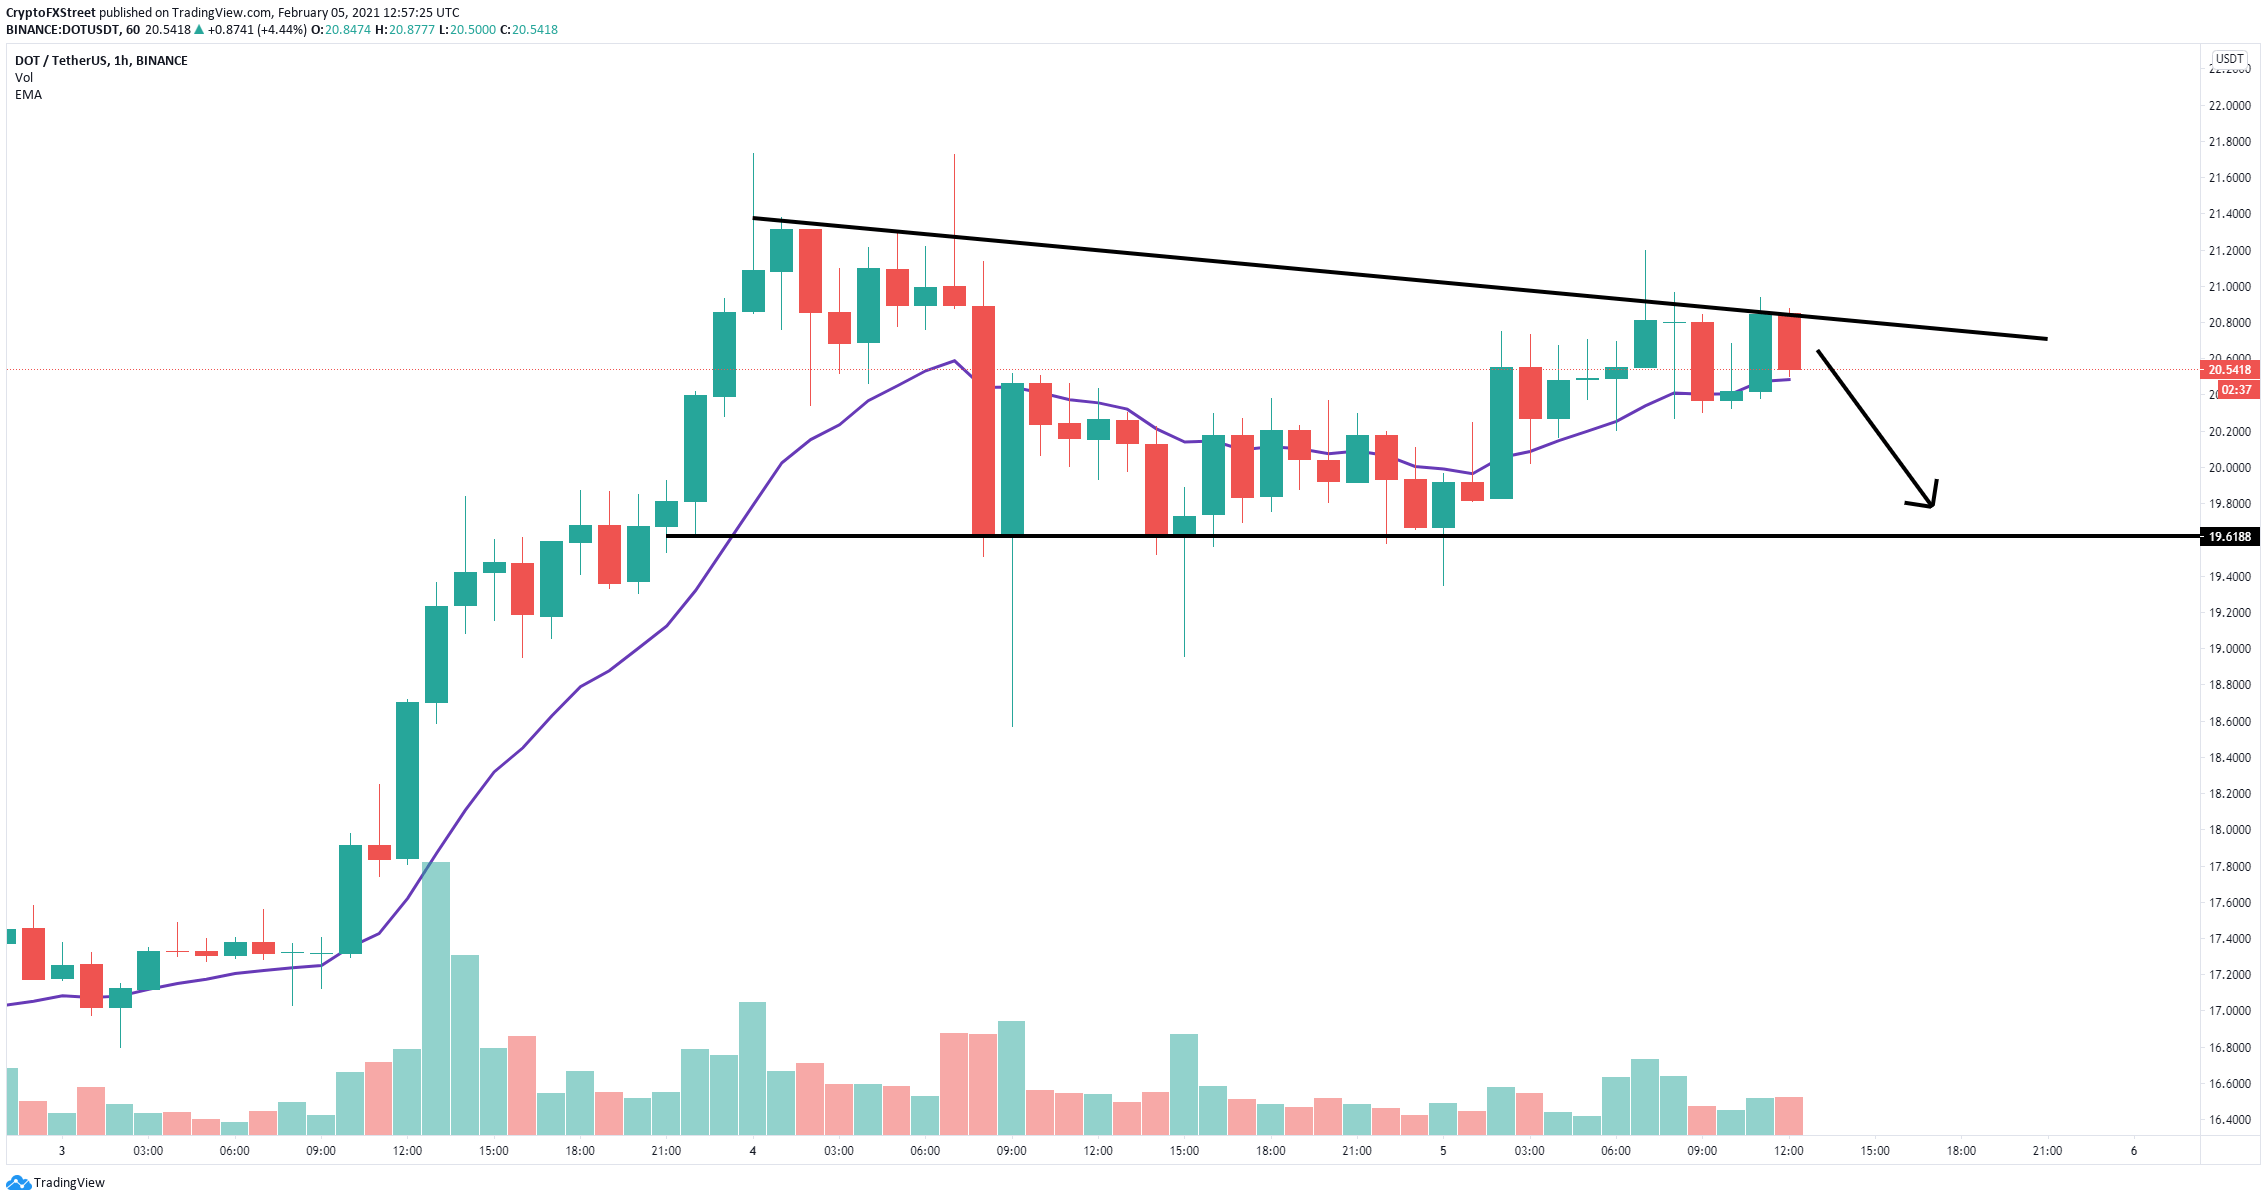
However, it seems that Polkadot price has been rejected from $20.9 and it’s on the verge of losing the 26-EMA on the 1-hour chart. If this level breaks, DOT can fall towards $19.6, which is the lower trendline of a descending triangle pattern formed on this chart.

Author

Lorenzo Stroe

Lorenzo Stroe

Independent Analyst

Lorenzo is an experienced Technical Analyst and Content Writer who has been working in the cryptocurrency industry since 2012. He also has a passion for trading.


More from Lorenzo Stroe
Share:

Editor's Picks

Shiba Inu Price Forecast: SHIB stalls as rising supply on exchanges warns of profit-taking

Shiba Inu stalls above $0.00000500 following two consecutive bullish months as upside momentum eases. Volatile investors' interest in the meme coin amid rising supply on exchanges warns of profit-taking despite consistent token burns.

Dogecoin Price Forecast: Whales accumulate as DOGE uptrend stalls below 200-day EMA

Dogecoin holds a modest bullish bias, trading above the key support zone around $0.090; however, it is capped below the 200-day Exponential Moving Average near $0.094. On-chain data shows certain whale wallets are accumulating DOGE tokens, while strengthening derivatives metrics support a rally ahead for the meme coin.

Ripple and Stellar outlook: Hold bullish bias above EMAs as derivatives back upside

Ripple and Stellar hold above the key support zones, hinting at an upside move. Derivatives metrics further support the recovery, with both altcoins showing positive funding rates and rising long positions. Derivatives data shows a bullish tilt among XRP and XLM traders.

Crypto Market Overview: Bitcoin steadies below $80,000 – INJ, AERO rally
Bitcoin (BTC) hovers around $79,000 on Tuesday, struggling to break above the sell wall between $80,000 and $82,850. The broader cryptocurrency market sentiment remains bullish, with the Fear and Greed Index showing a reading of 73. Injective (INJ) and Aerodrome Finance (AERO) post double-digit gains over the last 24 hours.
Bitcoin: Gearing up for a sharp move
Bitcoin (BTC) is trading around $81,000 on Friday, up over 4% so far this week, and awaits a key catalyst that could determine its next directional move. Strong institutional demand is supporting the bullish price action, with spot BTC Exchange Traded Funds (ETFs) on track to record a third straight week of inflows.

