Polkadot Price Prediction: DOT is poised for a significant correction to $16, suggests technicals
- Polkadot price seems to be on the verge of a massive correction as it is quite overextended.
- Several indicators and on-chain metrics suggest the digital asset must see a pullback before another leg up.
- DOT bears aim for a low of $16 if all the signals are validated.

Polkadot has reached a new all-time high on February 3 at $19.83 hitting a market capitalization of over $17.4 billion, almost surpassing XRP which stands at $17.8 billion. Unfortunately, many on-chain metrics and indicators show that Polkadot must face a correction.
Polkadot price can quickly fall towards $16
On the 4-hour and 6-hour charts, the TD Sequential indicator has presented two sell signals and it’s about to do the same on the 1-hour chart. Three calls in a row is an extremely bearish indicator that increases DOT’s selling pressure by a lot.
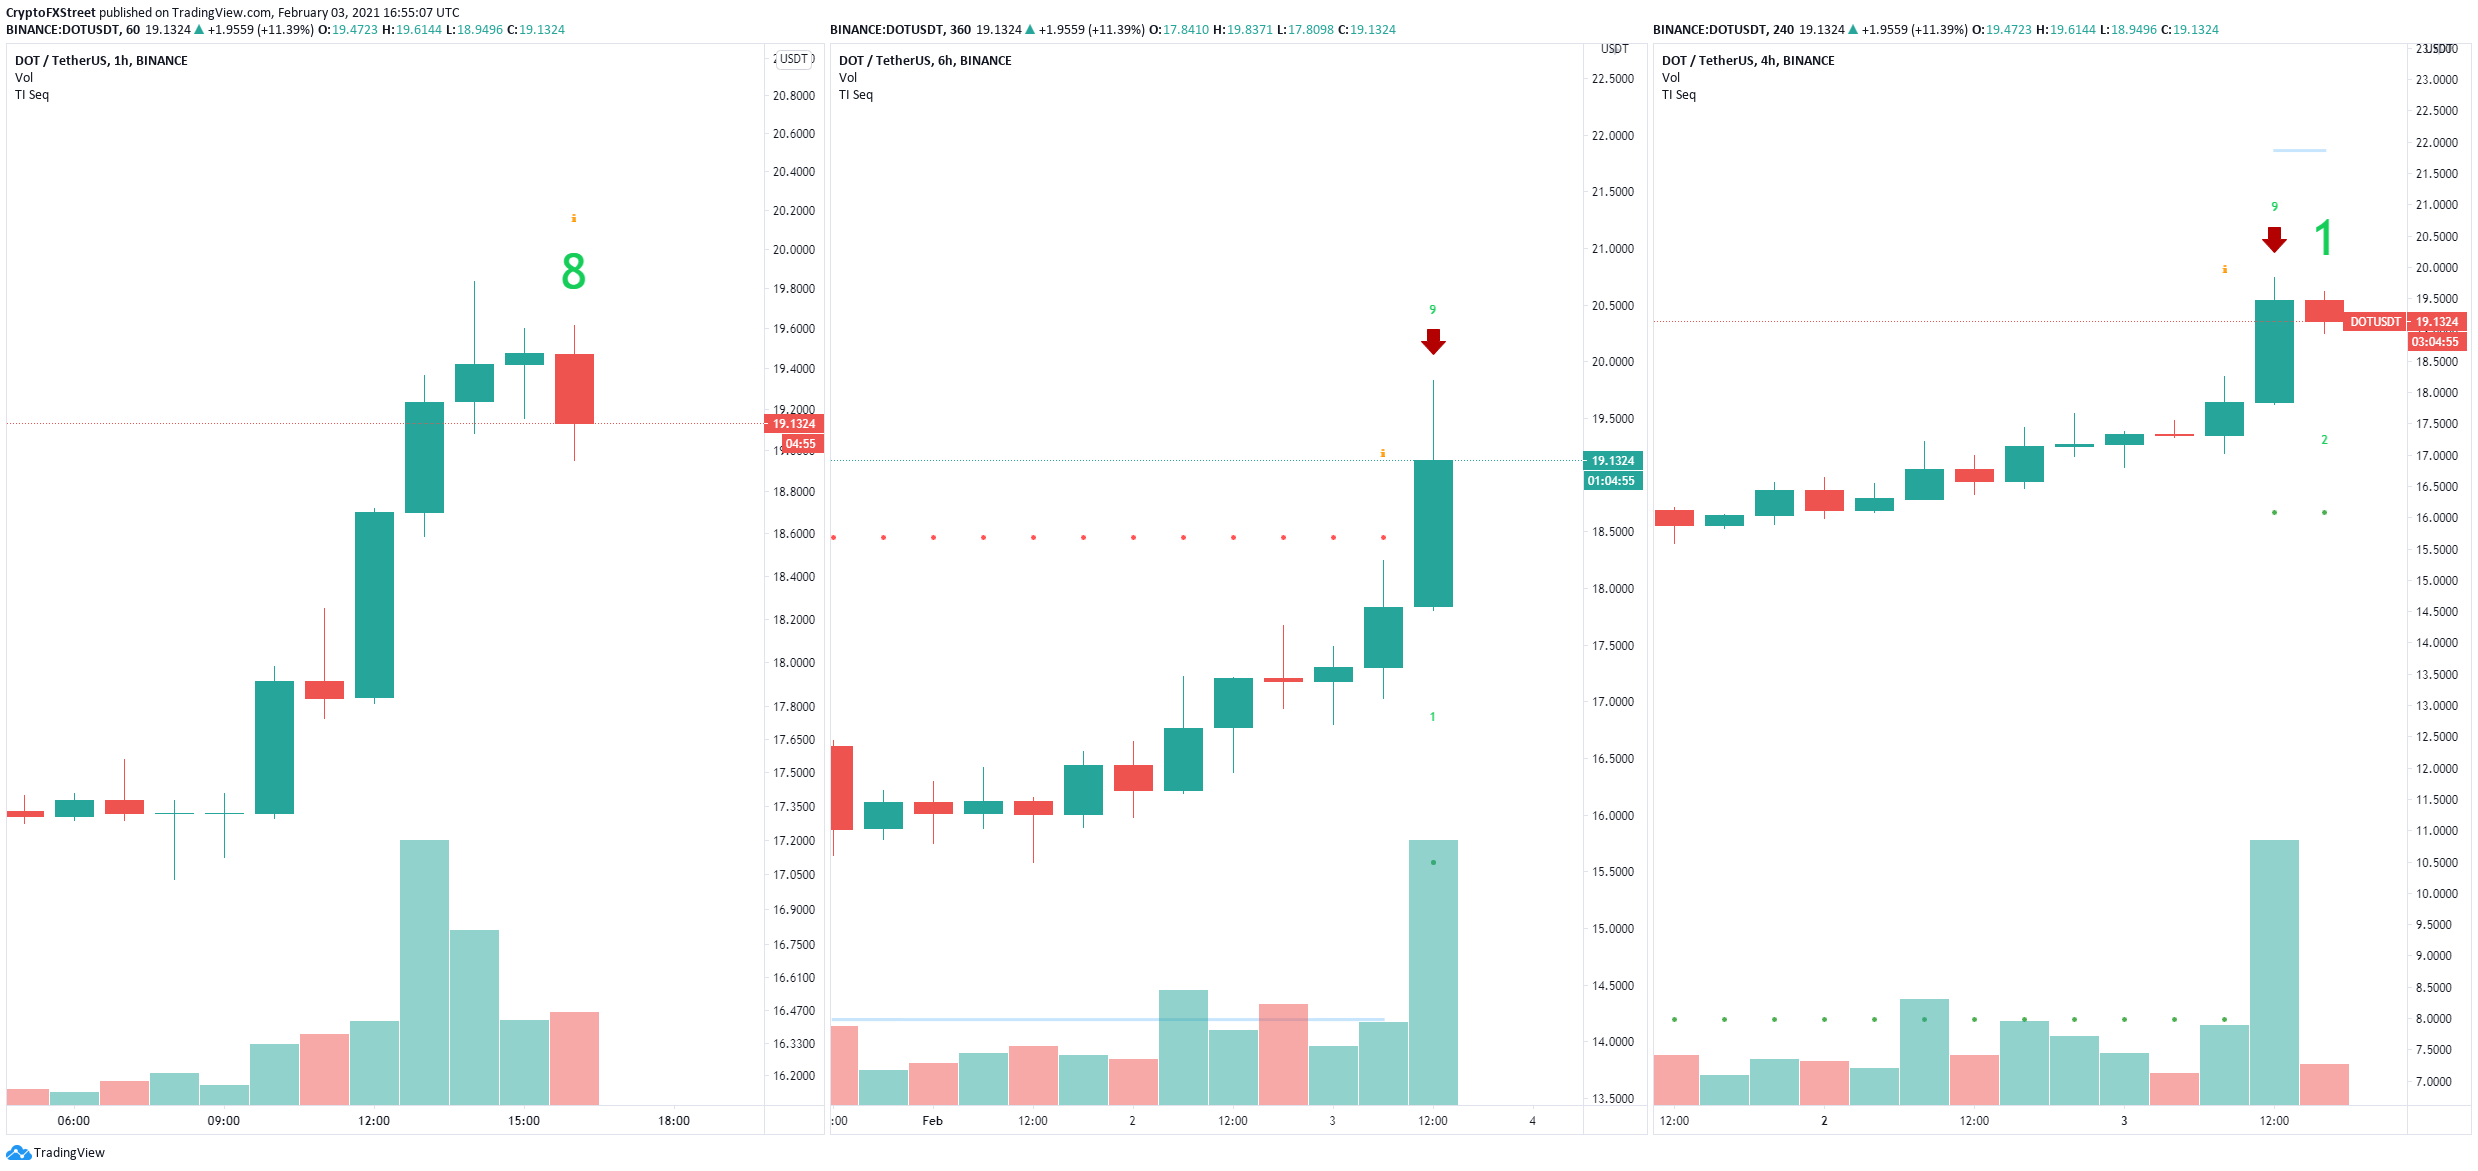
DOT sell signals
Additionally, DOT has experienced a massive spike in its social volume which is often a big indicator of a potential pullback just like it happened back on January 16 and December 31, 2020.
%20[18.01.17,%2003%20Feb,%202021]-637479687385586513.png)
DOT Social Volume
On the 4-hour chart, Polkadot continues trading inside an ascending parallel channel after getting rejected from the top trendline resistance at $20. In the past, a rejection from the upper boundary has always pushed DOT towards the lower trendline.
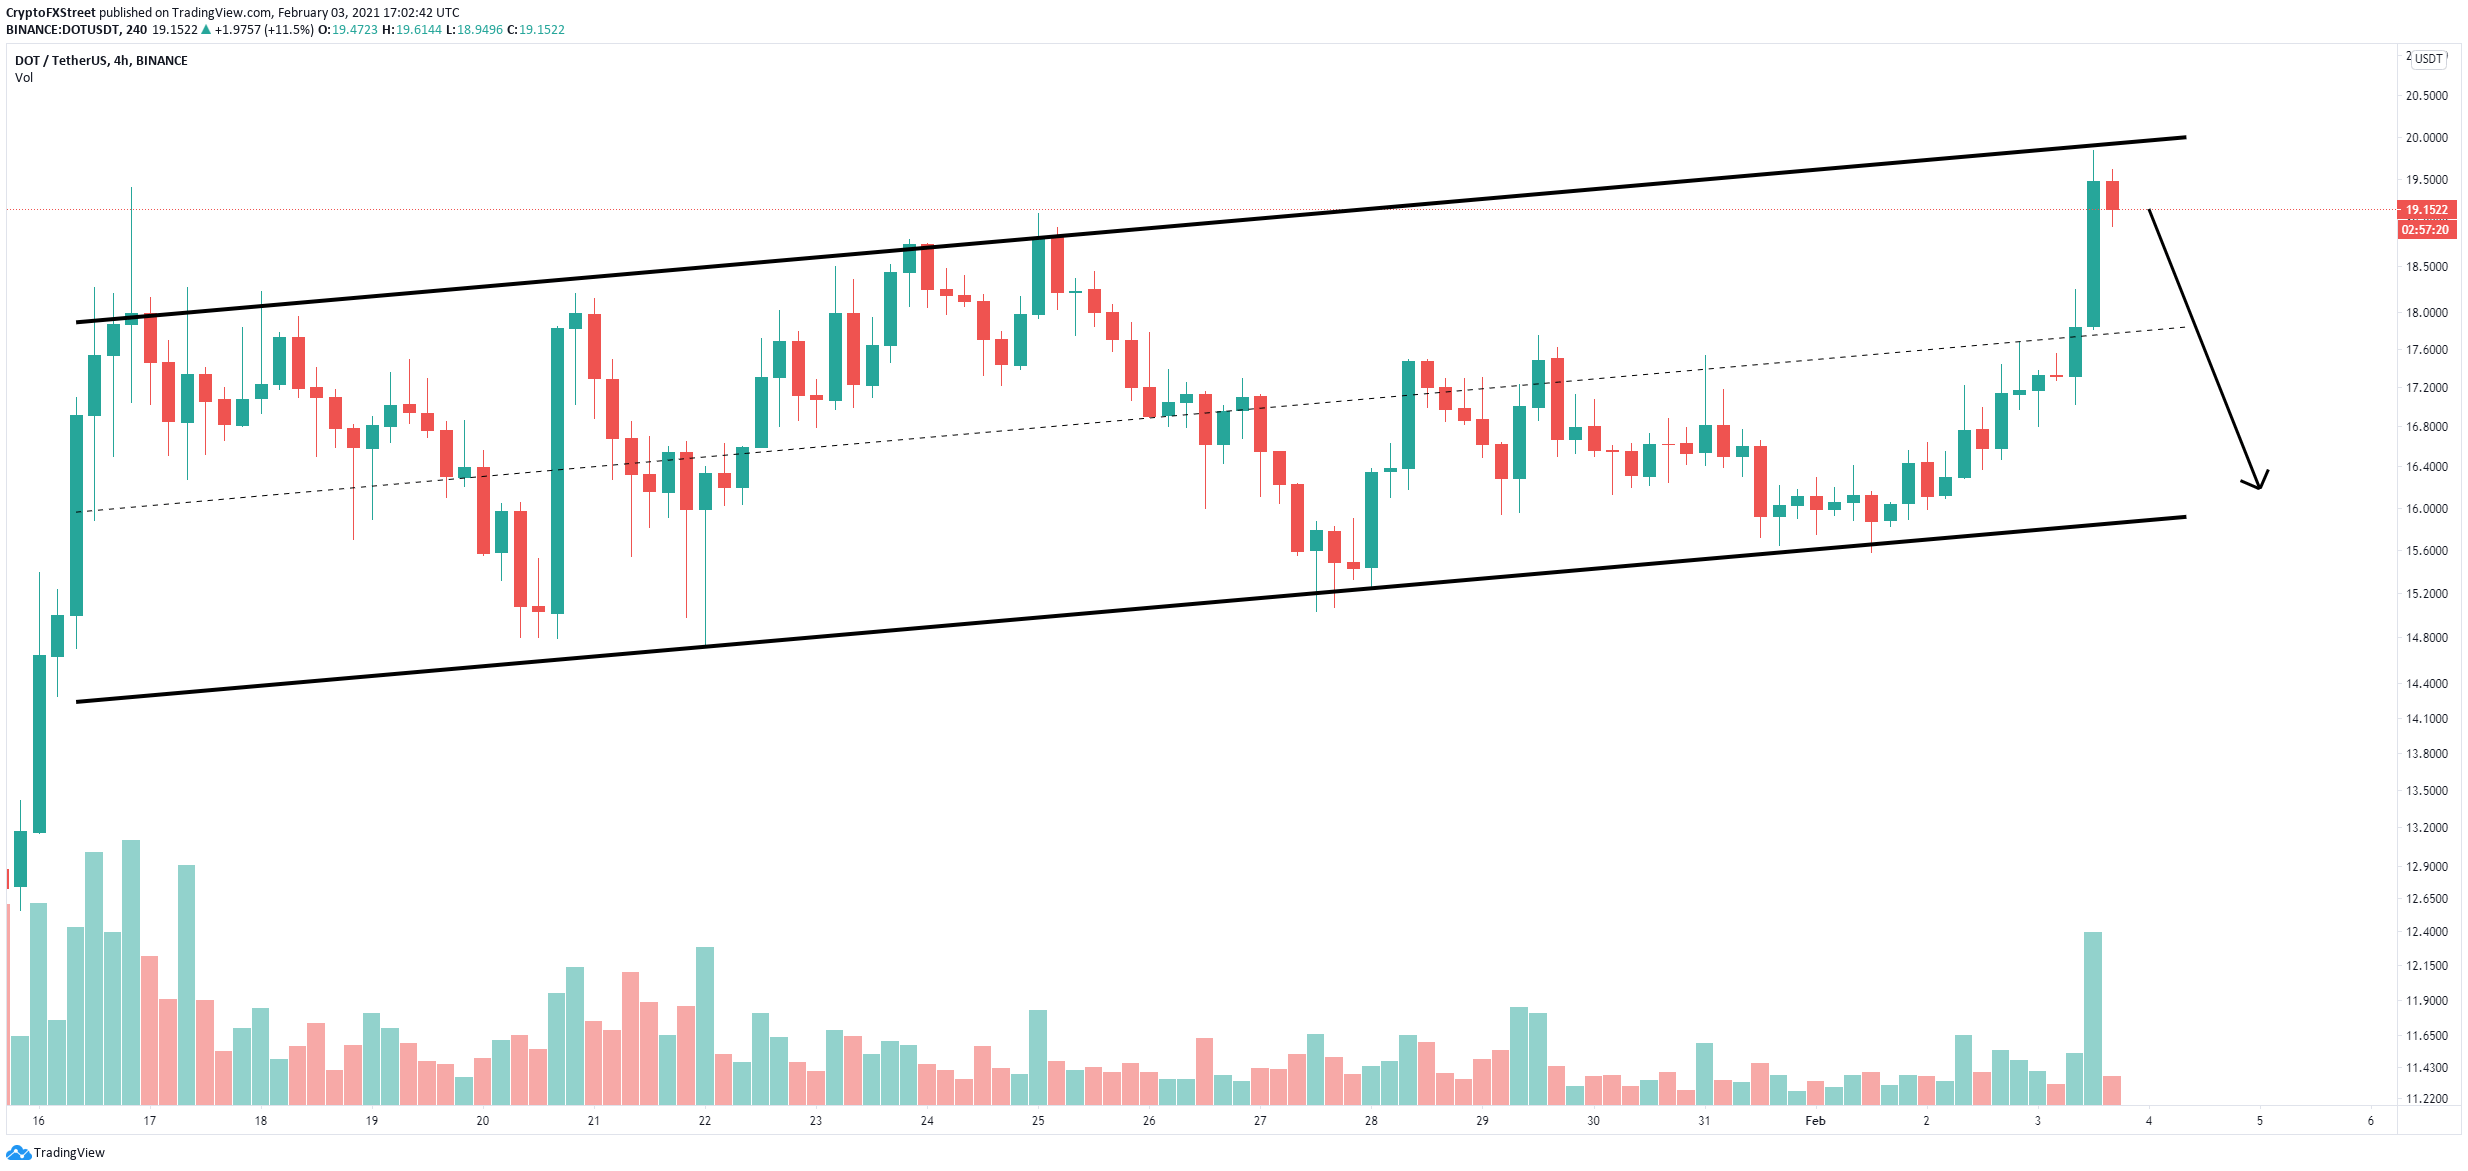
DOT/USD 4-hour chart
Since Polkadot price got rejected again, it will most likely fall towards the lower boundary of the pattern which is located at $16.
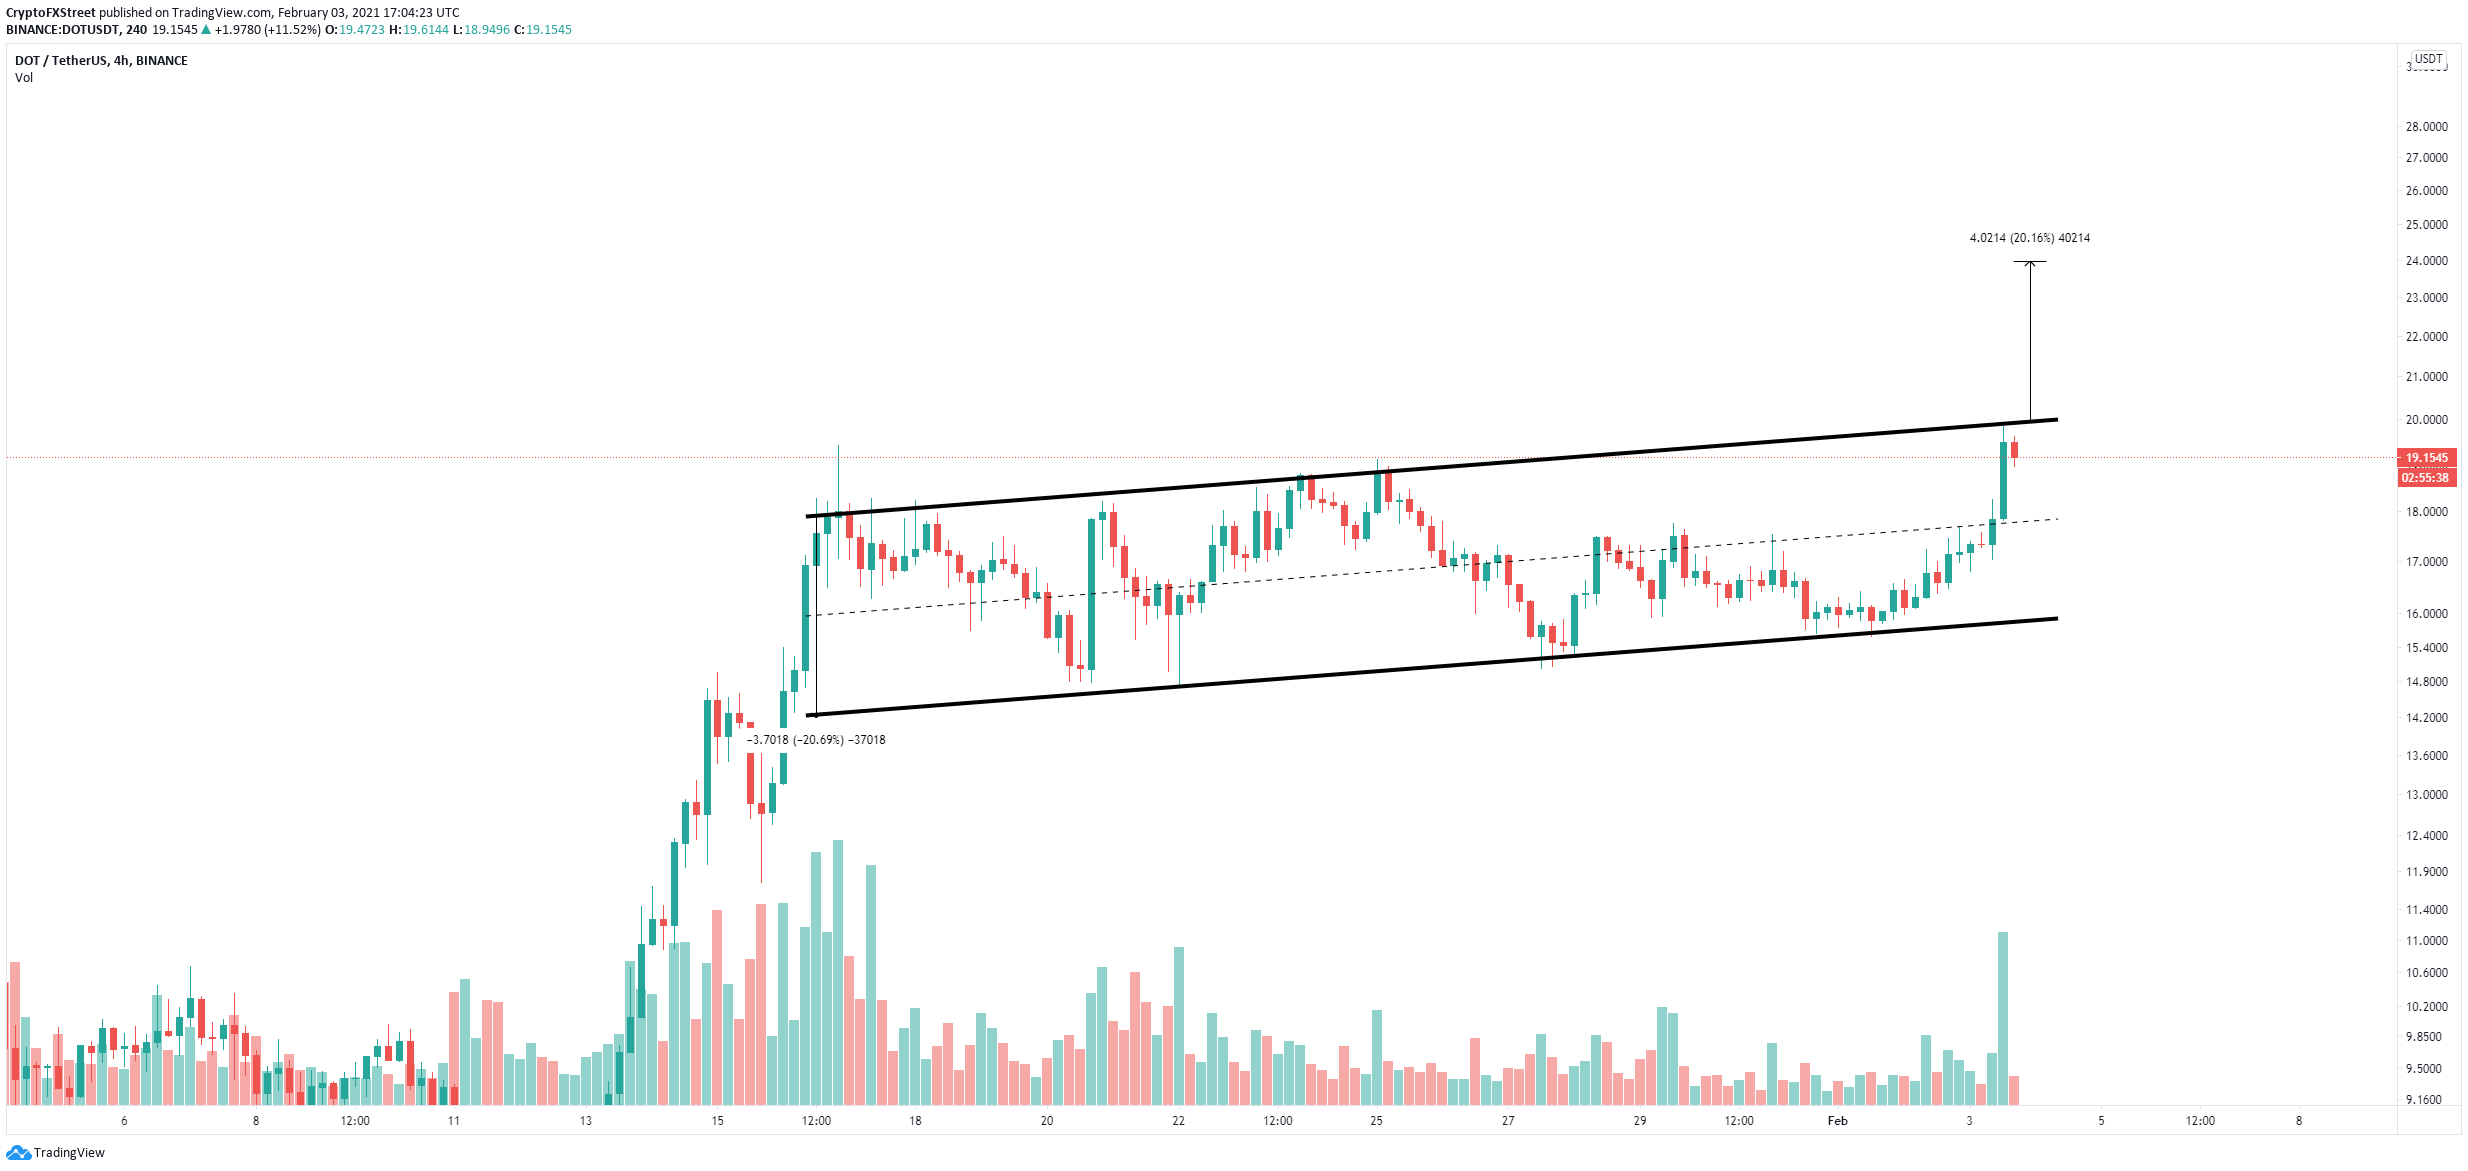
DOT/USD 4-hour chart
However, there is always a chance that the bulls crack the upper trendline resistance at $20. This breakout would have a price target of $24 which is a 20% move from $20.
Author

Lorenzo Stroe
Independent Analyst
Lorenzo is an experienced Technical Analyst and Content Writer who has been working in the cryptocurrency industry since 2012. He also has a passion for trading.


