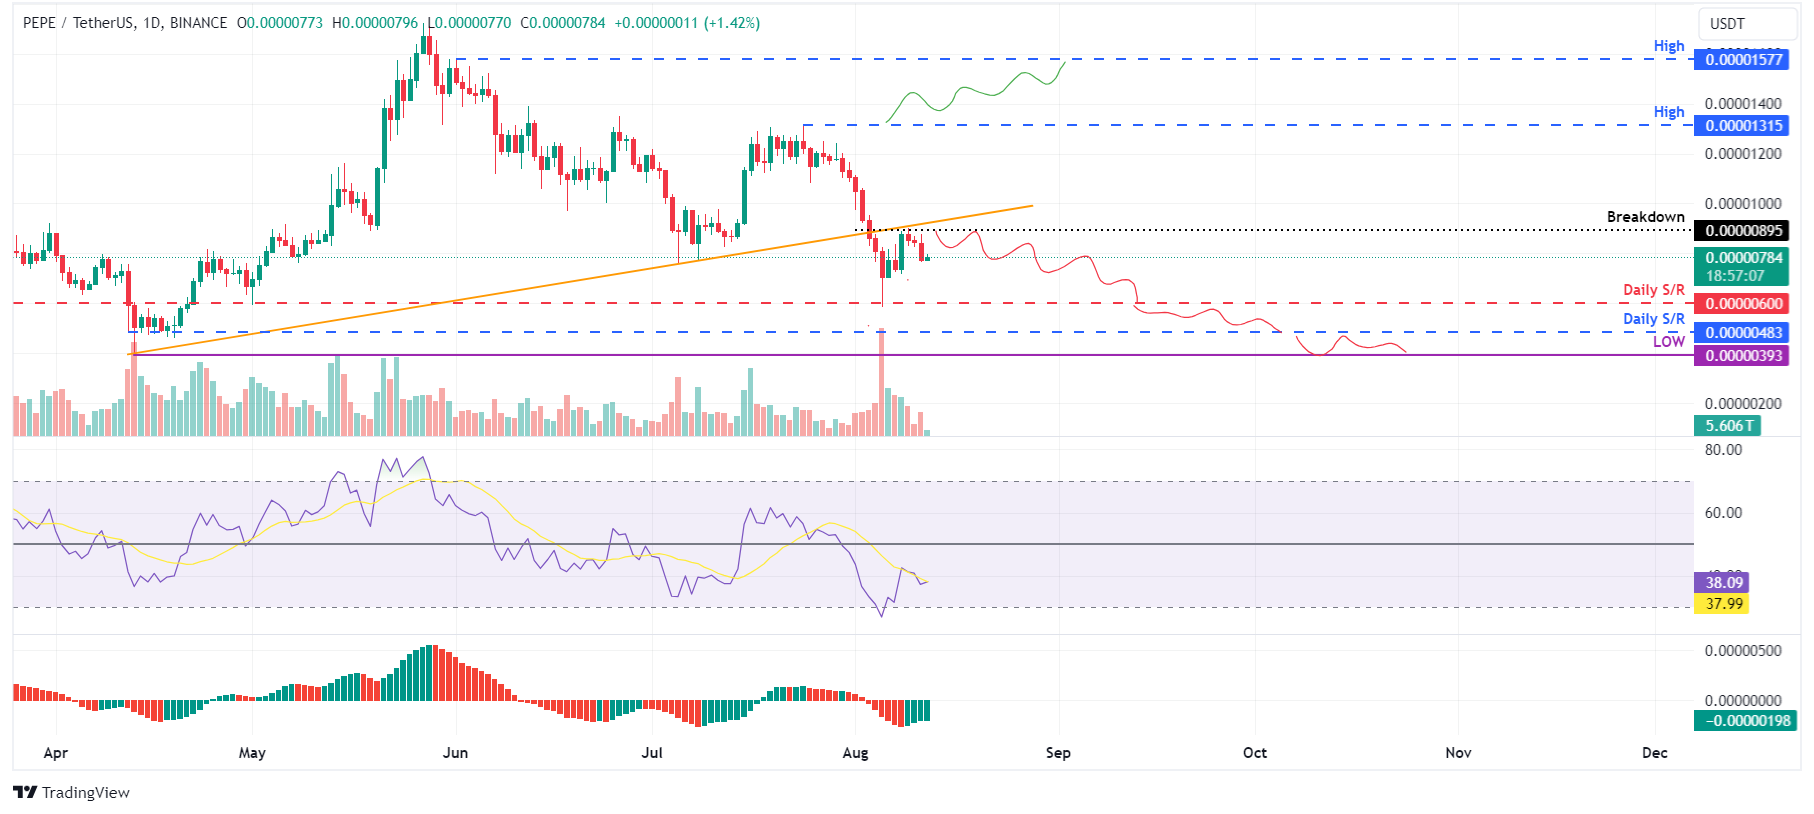
- PEPE price retests the ascending trendline pullback at $0.0000089, with impending decline on the horizon.
- Lookonchain shows a Whale deposited 395.92 billion PEPE tokens worth $3.4 million on Binance.
- PEPE's Exchange Flow Balance shows a positive spike, signaling a bearish price move.
- A daily candlestick close above $0.0000130 would invalidate the bearish thesis.
Pepe (PEPE) retested the breakdown level of its ascending trendline on Friday, resulting in a 9% decline over the following two days. On-chain data indicates a positive spike in Exchange Flow Balance, suggesting a bearish price movement shortly.
Additionally, Lookonchain data reveals that a whale deposited the remaining 395.92 billion PEPE tokens, valued at $3.4 million, on Friday, following a prior deposit of 400 billion PEPE tokens worth $4.22 million on August 1, which further reinforces the bearish outlook.
The whale deposited all the remaining 395.92B $PEPE($3.4M) into #Binance 4 hours ago.
— Lookonchain (@lookonchain) August 9, 2024
The whale made a total profit of $5.06M(+199%) on $PEPE.https://t.co/JAcApqwZV6 pic.twitter.com/zmGhctMv4Q
PEPE price could decline further on failed trendline pullback retest
Pepe retested the ascending trendline breakdown level at $0.0000089 on Friday, which had previously acted as support. It declined 9% in the next two days. On Monday, it trades slightly higher by 1.5% at $0.0000078.
If the $0.0000089 level holds as resistance, PEPE could crash 32% and retest its daily support at $0.0000060.
The Relative Strength Index (RSI) indicator and Awesome Oscillator (AO) on the daily chart are trading below the neutral levels of 50 and zero. These momentum indicators strongly indicate bearish dominance.
PEPE/USDT daily chart
On-chain data also points to a bearish outlook for PEPE price. According to IntoTheBlock's In/Out of the Money Map (IOMAP), approximately 4,230 addresses bought 12.87 trillion PEPE tokens at an average price of $0.000008. If the price rises at this level, this significant amount of investors may opt to sell to get a breakeven on their positions.
From a technical analysis perspective, the $0.000008 resistance level aligns with the IOMAP findings, marking this zone as a crucial reversal point to monitor.
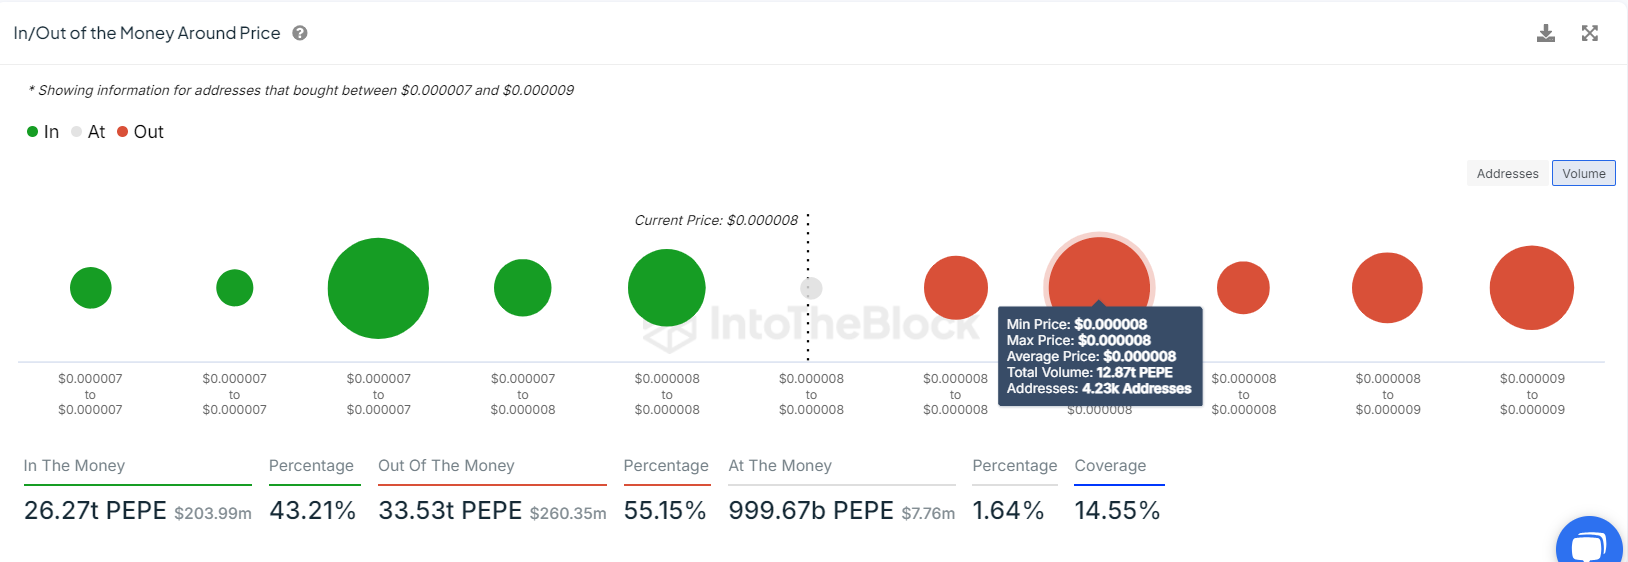
PEPE IOMAP chart
Santiment's Exchange Flow balance for PEPE shows the net movement of tokens into and out of exchange wallets. A positive value indicates more PEPE tokens entered than exited exchanges, suggesting selling pressure from investors. Conversely, a negative value indicates more PEPE left the exchange than entered, indicating less selling pressure from investors.
In PEPE's case, the Exchange Flow balance spiked from -299.91 billion to 773.91 billion from August 8 to August 9. This positive spike generally suggests increased selling activity among investors.
PEPE Exchange Flow balance chart
Even though on-chain metrics and technical analysis point to a bearish outlook, if Pepe's price produces a daily candlestick close above $0.0000131, the daily high from July 24, the move would invalidate the bearish thesis by making a higher high on the daily time frame. This development could see PEPE's price rally 20% to the next resistance level at the June 1 high of $0.0000157.
Information on these pages contains forward-looking statements that involve risks and uncertainties. Markets and instruments profiled on this page are for informational purposes only and should not in any way come across as a recommendation to buy or sell in these assets. You should do your own thorough research before making any investment decisions. FXStreet does not in any way guarantee that this information is free from mistakes, errors, or material misstatements. It also does not guarantee that this information is of a timely nature. Investing in Open Markets involves a great deal of risk, including the loss of all or a portion of your investment, as well as emotional distress. All risks, losses and costs associated with investing, including total loss of principal, are your responsibility. The views and opinions expressed in this article are those of the authors and do not necessarily reflect the official policy or position of FXStreet nor its advertisers. The author will not be held responsible for information that is found at the end of links posted on this page.
If not otherwise explicitly mentioned in the body of the article, at the time of writing, the author has no position in any stock mentioned in this article and no business relationship with any company mentioned. The author has not received compensation for writing this article, other than from FXStreet.
FXStreet and the author do not provide personalized recommendations. The author makes no representations as to the accuracy, completeness, or suitability of this information. FXStreet and the author will not be liable for any errors, omissions or any losses, injuries or damages arising from this information and its display or use. Errors and omissions excepted.
The author and FXStreet are not registered investment advisors and nothing in this article is intended to be investment advice.
Recommended Content
Editors’ Picks

Crypto Today: BTC, ETH, and XRP lead $1.4B capitulation on Black Monday as FTX denies $2.5B claims
Cryptocurrencies nosedived over the weekend, shedding over $300 billion since Friday. What some traders on social media are terming crypto’s Black Monday, losses come after an initial positive decoupling on Thursday, when US stocks crashed after China announced 34% retaliatory tariffs.

Bitcoin hits new yearly low below $75,000 as global trade war escalates
Bitcoin price extends its fall by 4% on Monday after correcting near 5% the previous week. The global trade war escalated, wiping out 452,976 leveraged traders and causing a total liquidation of $1.39 billion from crypto markets in the last 24 hours.

Dogecoin shatters $0.15 support as ‘Black Monday’ bloodbath fears surge
Dogecoin tumbles over 10% on Monday, slashing $3.73 billion from its market capitalization to $19.78 billion. CNBC host Jim Crammer warns of global markets’ bloodbath if US President Donald Trump stays intrasigent.

Solana Price Forecast: Bears gain momentum as SOL falls below $100
Solana (SOL) extends its loss by over 7% and falls below the $100 mark at the time of writing on Monday after crashing 15.15% last week. Coinglass data shows that SOL’s leveraged traders wiped out nearly $70 million in liquidations in the last 24 hours.

Bitcoin Weekly Forecast: Tariff ‘Liberation Day’ sparks liquidation in crypto market
Bitcoin (BTC) price remains under selling pressure and trades near $84,000 when writing on Friday after a rejection from a key resistance level earlier this week.

The Best brokers to trade EUR/USD
SPONSORED Discover the top brokers for trading EUR/USD in 2025. Our list features brokers with competitive spreads, fast execution, and powerful platforms. Whether you're a beginner or an expert, find the right partner to navigate the dynamic Forex market.