- PEPE hit a new all-time high at $0.00001725 on Monday, May 27.
- The frog-themed meme coin noted a surge in active addresses and social dominance amidst rising price.
- PEPE extended gains by over 4% on Monday and added 81% to its value in the past seven days.
PEPE, a frog-themed meme coin, hit a new all-time high early on Monday, rallying to a peak of $0.00001725. The asset rallied 81% in the past seven days on Binance.
Meme coins have consistently extended gains in the ongoing cycle, alongside a rally in Bitcoin, Ethereum and other cryptocurrencies in the top 20 assets by market capitalization. Dogecoin (DOGE), Shiba Inu (SHIB), Pepe (PEPE) and Solana-based meme coins have rallied on several occasions since the approval of Spot Bitcoin Exchange Traded Funds (ETFs) early in 2024.
PEPE currently ranks as the 19th largest cryptocurrency by market capitalization on Coinmarketcap.
PEPE hits new all-time high alongside bullish on-chain metrics
Data from crypto intelligence tracker Santiment shows that there has been a massive spike in PEPE’s active addresses and social dominance between May 20 and 27. Active addresses nearly doubled in the timeframe, and social dominance, a metric that measures the share of PEPE’s mentions in crypto discussions on social media platforms, climbed from 0.81% to 3.55% in the same period.
PEPE active addresses and social dominance
Santiment data reveals that PEPE supply on exchanges is nearly at the same level as May 20, posting a 0.3% increase between May 20 and 27. This implies that there is less likelihood of higher selling pressure on PEPE, and the meme coin could extend gains further.
PEPE price could extend gains by nearly 25%
PEPE has been in an uptrend since April 14. The meme coin has formed higher highs and higher lows with an impulsive upward move noted on May 20 and 21. PEPE rallied to its new all-time high of $0.00001725 on Binance early on Monday.
The momentum indicator, the Moving Average Convergence Divergence (MACD), supports PEPE price gains with green histogram bars above the neutral line. This suggests positive underlying strength in the meme coin’s price uptrend.
The Relative Strength Index (RSI) reads 77.81, well above the neutral boundary at 70. While PEPE is in the overbought zone, the positive underlying momentum implies the asset could extend gains further.
Traders opening a long position need to be cautious while RSI is in the overbought zone on the 1-day timeframe.
PEPE could extend gains by nearly 25% to 127.2% Fibonacci extension of the rally from the April 13 low of $0.00000393 to the May 27 peak of $0.00001725.
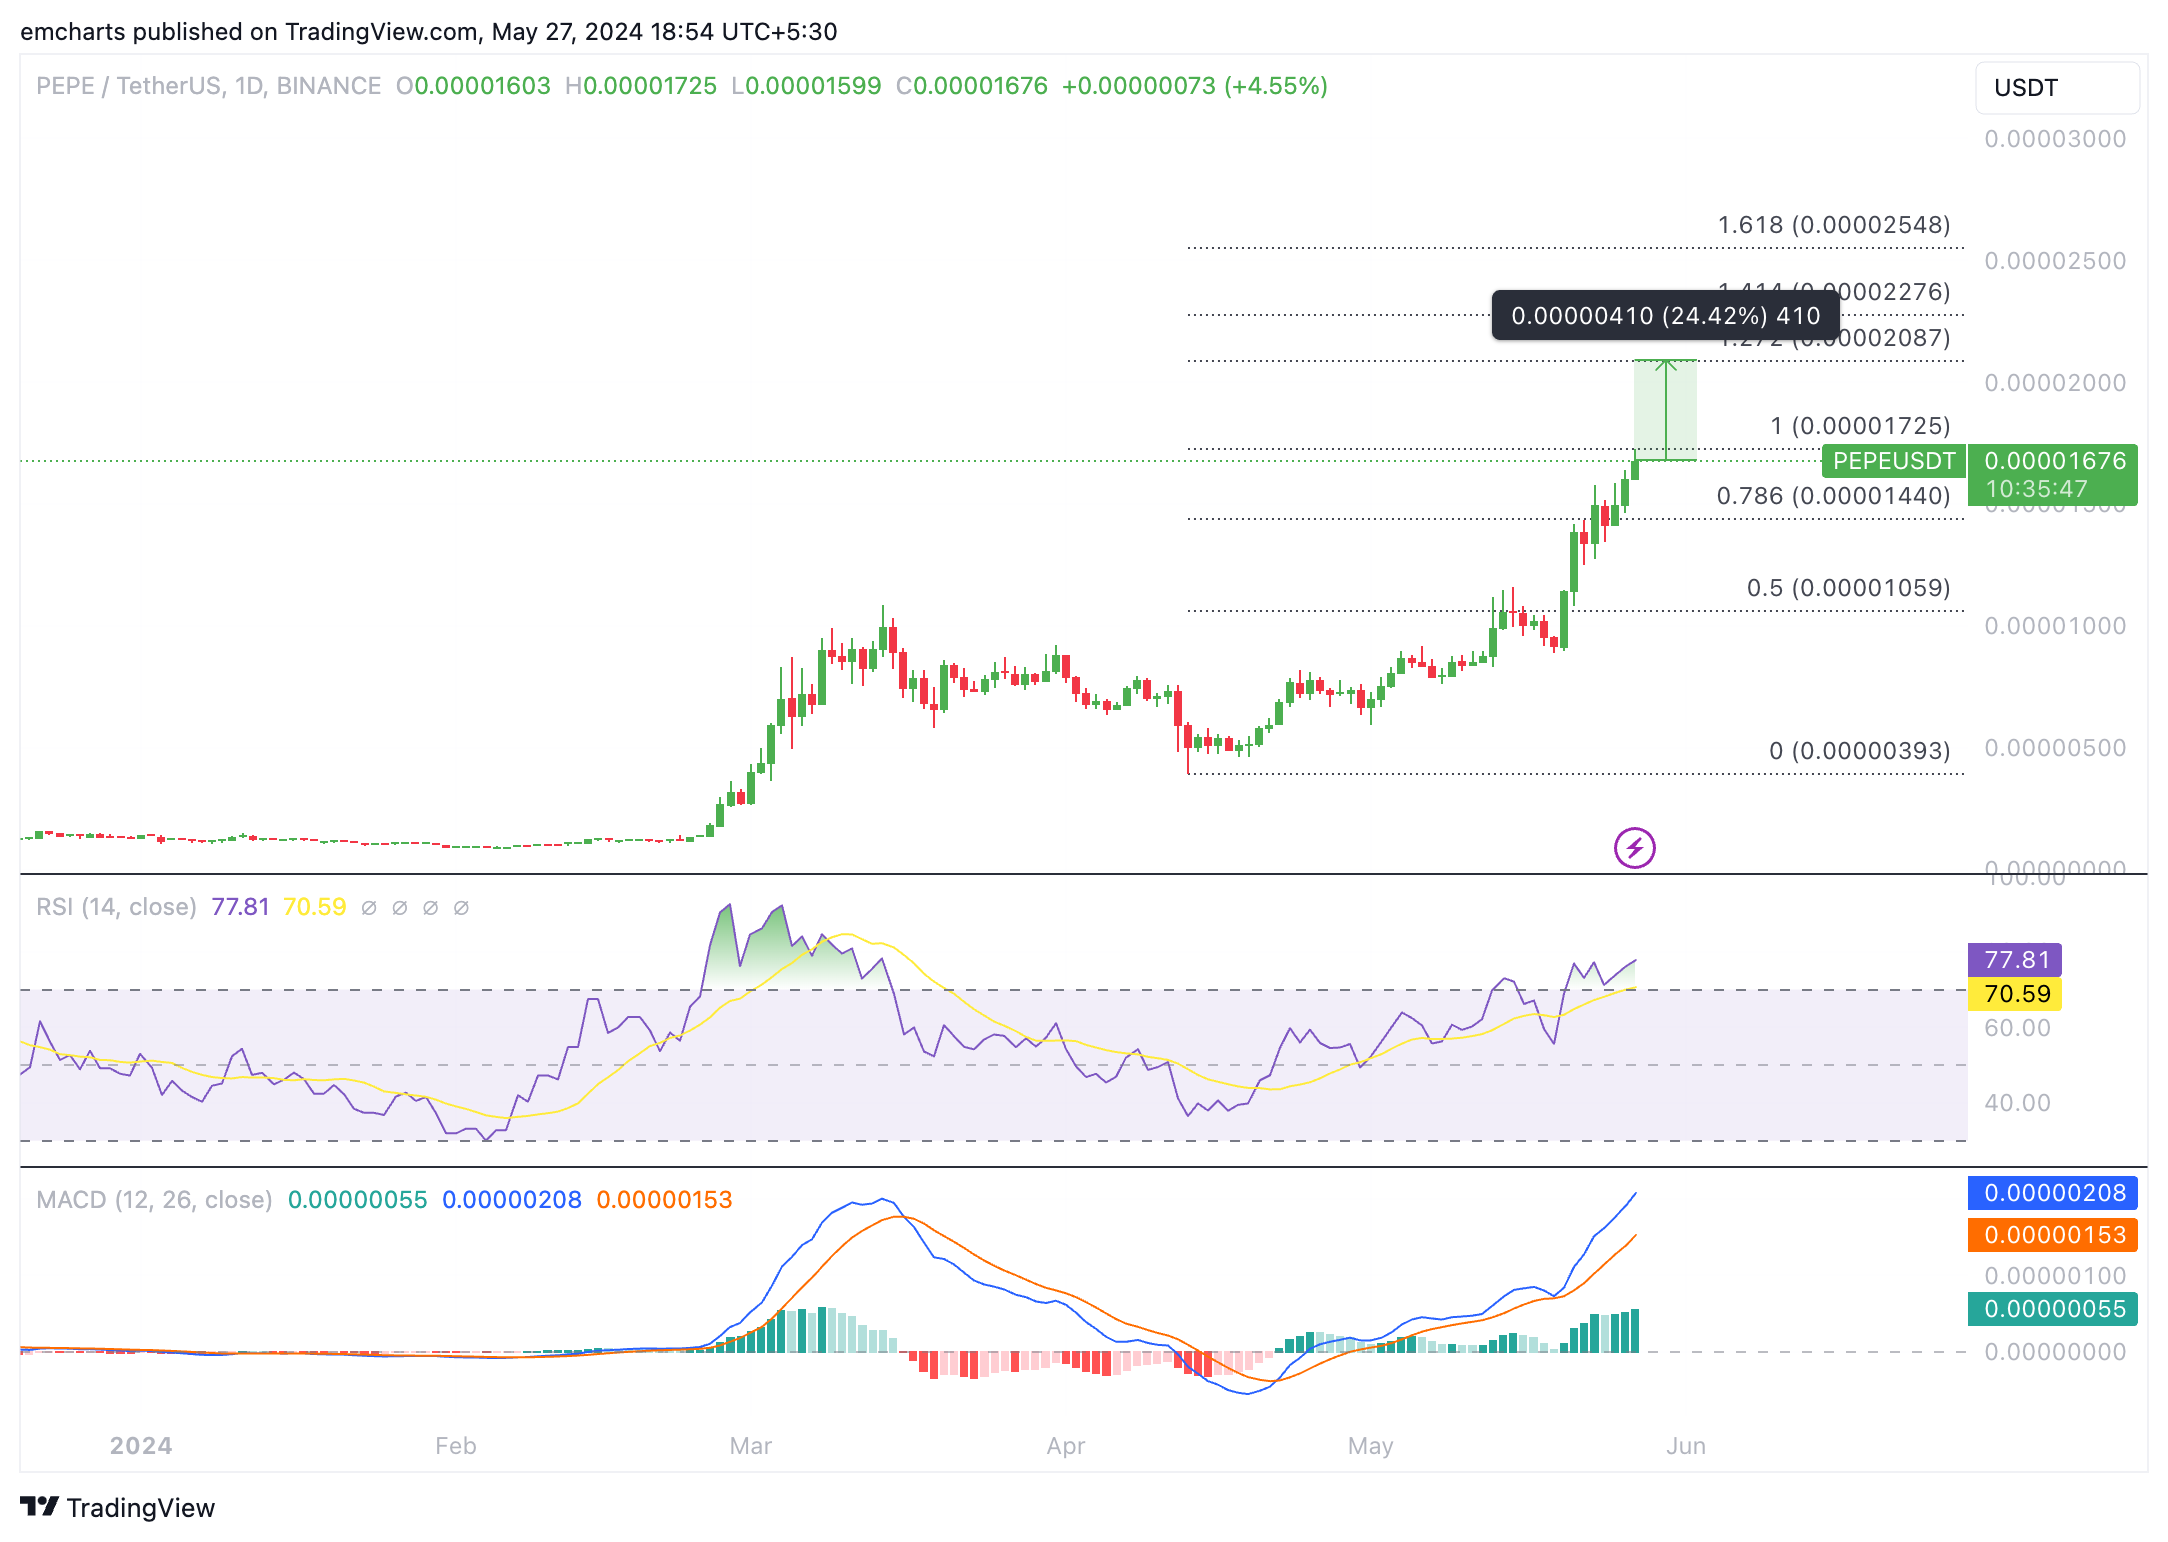
PEPE/USDT 1-day chart
PEPE could find support at the May 23 low of $0.00001276 in the event of a correction in the asset’s price.
Information on these pages contains forward-looking statements that involve risks and uncertainties. Markets and instruments profiled on this page are for informational purposes only and should not in any way come across as a recommendation to buy or sell in these assets. You should do your own thorough research before making any investment decisions. FXStreet does not in any way guarantee that this information is free from mistakes, errors, or material misstatements. It also does not guarantee that this information is of a timely nature. Investing in Open Markets involves a great deal of risk, including the loss of all or a portion of your investment, as well as emotional distress. All risks, losses and costs associated with investing, including total loss of principal, are your responsibility. The views and opinions expressed in this article are those of the authors and do not necessarily reflect the official policy or position of FXStreet nor its advertisers. The author will not be held responsible for information that is found at the end of links posted on this page.
If not otherwise explicitly mentioned in the body of the article, at the time of writing, the author has no position in any stock mentioned in this article and no business relationship with any company mentioned. The author has not received compensation for writing this article, other than from FXStreet.
FXStreet and the author do not provide personalized recommendations. The author makes no representations as to the accuracy, completeness, or suitability of this information. FXStreet and the author will not be liable for any errors, omissions or any losses, injuries or damages arising from this information and its display or use. Errors and omissions excepted.
The author and FXStreet are not registered investment advisors and nothing in this article is intended to be investment advice.
Recommended Content
Editors’ Picks
Convex Finance extends gains after facing short squeeze
![Convex Finance extends gains after facing short squeeze](https://editorial.fxstreet.com/images/Resources/CryptoWorldSEO2_XtraSmall.jpg)
Convex Finance (CVX), the DeFi token, extends its rally to double-digit gains and raises 26% on Monday, as seen on Binance. Data from Coinglass shows large volume liquidation of short positions, to the tune of $722,000.
XRP stuck below $0.50 while SEC abandons demand for $2 billion penalty
![XRP stuck below $0.50 while SEC abandons demand for $2 billion penalty](https://editorial.fxstreet.com/images/Resources/CryptoWorldSEO3_XtraSmall.jpg)
XRP struggles to make a comeback above sticky resistance at $0.50 on Monday as traders continue to assess the legal skirmishes between blockchain firm Ripple and the US Securities and Exchange Commission (SEC).
Quant price poised for a short-term sell-off amid potential early-holder selling spree
![Quant price poised for a short-term sell-off amid potential early-holder selling spree](https://editorial.fxstreet.com/images/Markets/Currencies/Cryptocurrencies/QuantNetwork/quant-logo_XtraSmall.png)
Quant (QNT) price could have a short-term downward pressure. Data from Lookonchain suggests that an early holder has deposited 118,008 QNT tokens worth $9.78 million into the Kraken exchange.
Top 3 Price Prediction Bitcoin, Ethereum, Ripple: Bitcoin retesting its major resistance level
![Top 3 Price Prediction Bitcoin, Ethereum, Ripple: Bitcoin retesting its major resistance level](https://editorial.fxstreet.com/images/Markets/Currencies/Cryptocurrencies/cryptocurrenciesusd_XtraSmall.jpg)
Bitcoin price is retesting its weekly resistance level of $67,147. Ethereum price finds support around $3,321, the price imbalance between $3,146 and $3,498. Ripple price faces rejection due to the key resistance level of $0.499.
Bitcoin: Has BTC found a local price bottom?
![Bitcoin: Has BTC found a local price bottom?](https://editorial.fxstreet.com/images/Markets/Currencies/Digital%20Currencies/Bitcoin/bitcoin_closer_XtraSmall.jpg)
Bitcoin (BTC) price looks set for a mild fall this week, weighed by slight outflows in the US spot ETFs and the US Fed keeping a hawkish interest-rate outlook despite easing inflation. Technical indicators suggest that BTC could face a further 5% correction in the short term before resuming the uptrend.