On-chain metrics reveal buying power ready to flow into Bitcoin for the ultimate push to $50,000
- Bitcoin Stablecoin Supply Ratio remains extremely low, suggesting that buying pressure behind BTC is high.
- The supply of BTC on exchanges recently hit a 30-month low, implying that holders are more than traders.
- Bitcoin must close the day above the 200 SMA and $34,000 to sustain and validate the recovery eyeing $50,000.

Bitcoin has made minor progress since the drop from $38,000 to $32,000. However, as discussed on Monday, stablecoins exchange inflow proposes that buying pressure is poised to return to the market, which will eventually catapult Bitcoin to incredible levels, perhaps at $50,000.
Bitcoin on-chain metrics remain strong
Bitcoin is relatively stable despite the drop from $38,000. Realize, the pioneer cryptocurrency kicked off last week’s trading above $32,000 and ended the week above $33,000. Currently, Bitcoin is trading above $34,000 amid the persistent push from the bullish camp.
Glassnode, a prominent on-chain analysis platform, brings to light the insistent decrease in Bitcoin’s Stablecoin Supply Ratio (SSR). The drop has been significant in 2021 despite the large volume of stablecoins being minted.
Understanding the Stablecoin Supply Ratio
The metric refers to the ratio calculated between the supply of BTC and the stablecoins supply. This recent article explained how stablecoins maintain their stability while shunning volatility.
The ratio is expressed in BTC or sometimes in the Bitcoin market cap or the stablecoin market cap. The stablecoins currently used in the computation include USDT, TUSD, USDC, PAX, GUSD, DAI, SAI, and BUSD.
It is worth noting that a low SSR ratio implies that the prevailing stablecoin supply yields more “buying power” for purchasing BTC. One can think of this ratio as a proxy for supply and demand mechanics regarding BTC and USD.
Similarly, when Bitcoin price is high, less of the stablecoin supply is utilized in buying BTC; hence it hinders further upward movement. On the flip side, a high SSR suggests that fiat has the low buying power to push Bitcoin higher, culminating in increased selling pressure.
Bitcoin SSR chart
The current SSR is extremely low despite high Bitcoin prices. This figure shows that the market is quite bullish for Bitcoin mainly because as more and more stablecoins are minted, they are deposited on exchanges. The deposits create liquidity that is currently being used to purchase more Bitcoin.
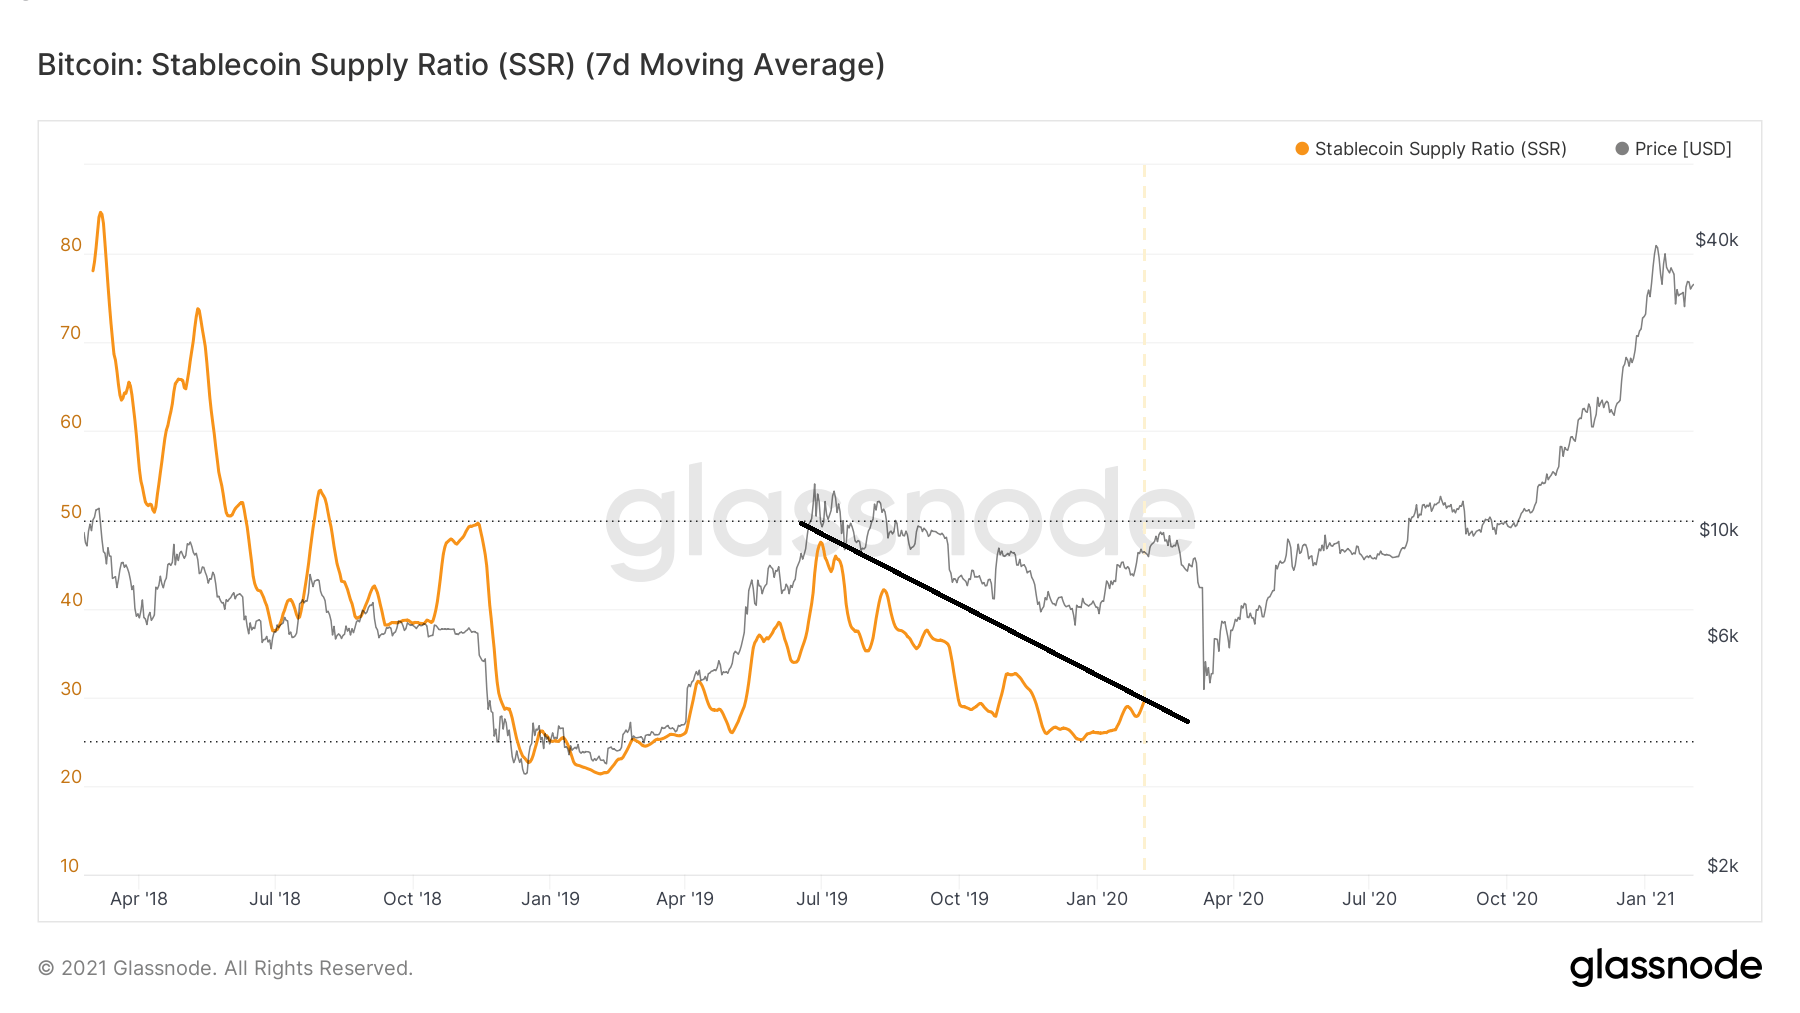
Bitcoin SSR chart by Glassnode
Bitcoin balance in exchange wallets drops significantly
The Bitcoin supply kept in cryptocurrency exchange wallets has decreased to a 30 month low, which is also a bullish signal. Glassnode updates the data from available exchange wallets frequently.
As this supply falls, it shows that Bitcoin is getting more and more holders as traders diminish. If demand for Bitcoin continues to rise amid the supply bottleneck, the price will eventually rally to higher levels.
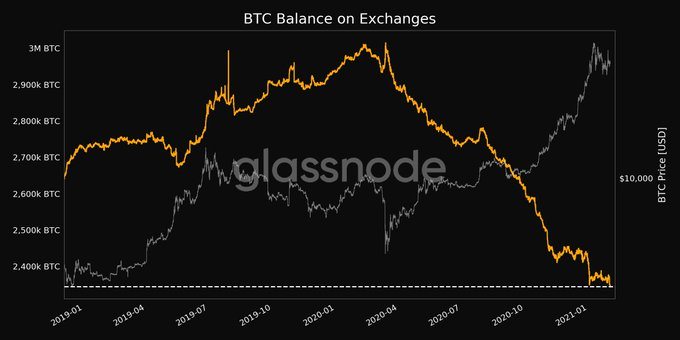
Bitcoin supply in exchange wallets
Bitcoin on the verge of another breakout
The 4-hour chart shows Bitcoin making its way above $34,000 after bouncing off the 100 Simple Moving Average Support. Meanwhile, the 200 SMA is the ultimate test for the strength of the uptrend.
A break above the short term resistance would leave BTC with open-air to soar to highs around $36,000 before the bullish leg to $38,000, and $40,000 is formulated. Another bullish indicator would be the Moving Average Convergence Divergence, whereby the MACD line (blue) will confirm the breakout on crossing above the signal line.
%20-%202021-02-02T092022.646-637478448411083773.png)
BTC/USD 4-hour chart
Looking at the other side of the fence'
Bitcoin will resume the downtrend if the near term hurdle at the 200 SMA remains unshaken. In addition to BTC failing to close the day above $34,000, overhead pressure will soar on the immediate support at the 100 SMA.
The bearish leg is likely to head back to $32,000, mostly if the 50 SMA support does nothing to halt the losses. If Bitcoin slips to $30,000 again, a Pandora box might be opened, leading to losses toward $25,000.
Author

John Isige
FXStreet
John Isige is a seasoned cryptocurrency journalist and markets analyst committed to delivering high-quality, actionable insights tailored to traders, investors, and crypto enthusiasts. He enjoys deep dives into emerging Web3 tren


