OMG Network Price Analysis: OMG is ready for another leg up after 70% gains
- OMG is up by more than 70% since its low on September 21 at $2.48.
- The digital asset has turned several indicators in its favor and looks poised for another move up.

OMG is currently trading at $3.8 and has been outperforming the market for the past three days. Santiment, a behavior analytics platform, has released a report on whether the digital asset will continue soaring or not.
OMG Exchange Inflow Chart
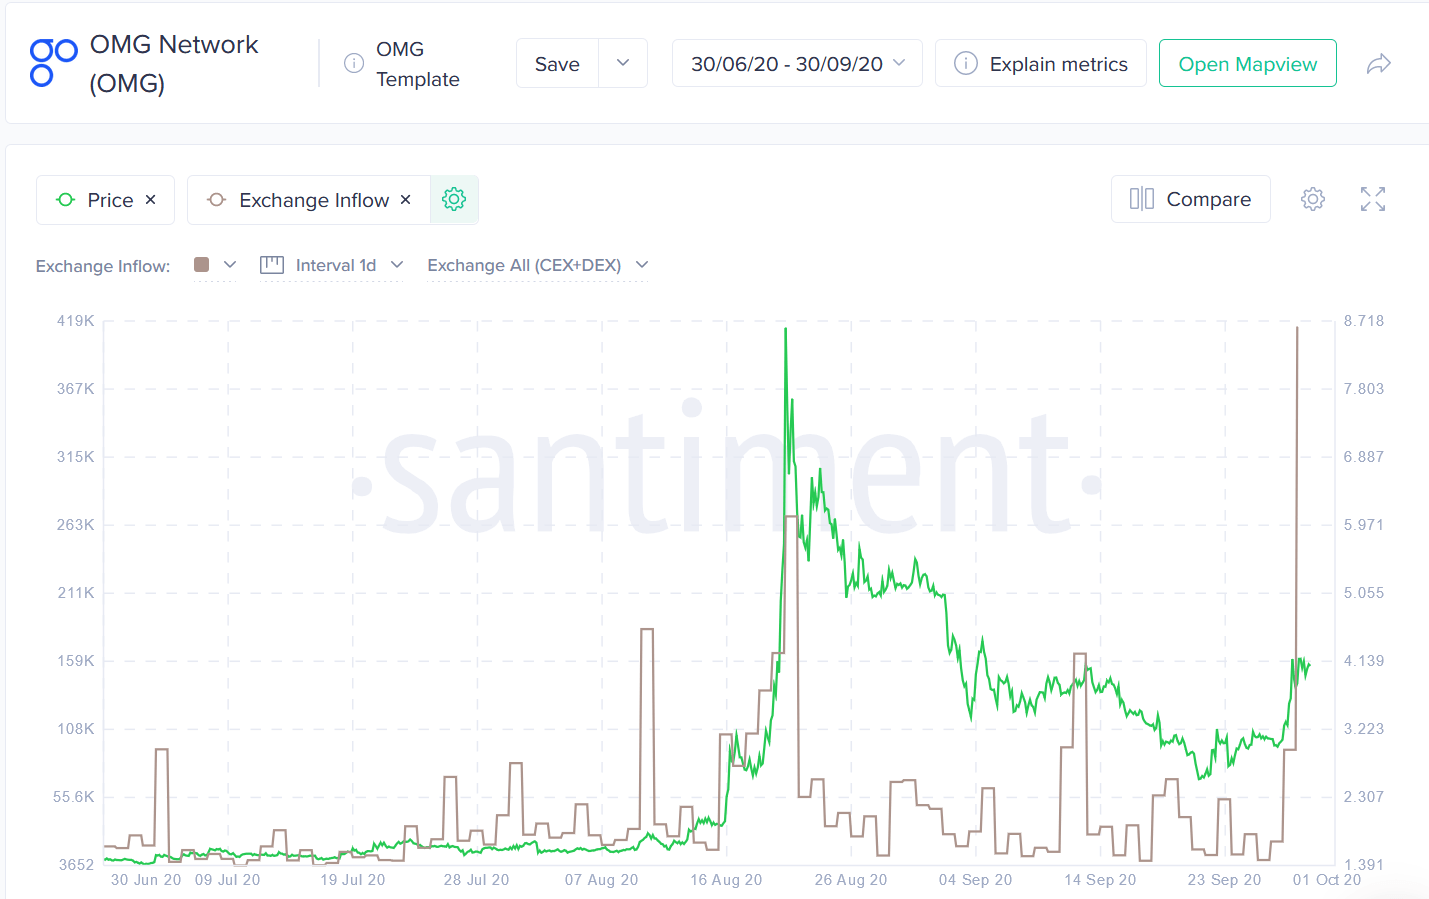
According to Santiment, OMG has been one of the top-performing assets in the past 36 hours. It seems that the exchange inflow of coins had eclipsed its previous high in August when 270,000 OMG coins were moved to exchanges. Although this metric usually indicates a potential selloff or at least intense selling pressure, Santiment points out that active OMG deposits have been lower than in August.
OMG Daily Active Deposits
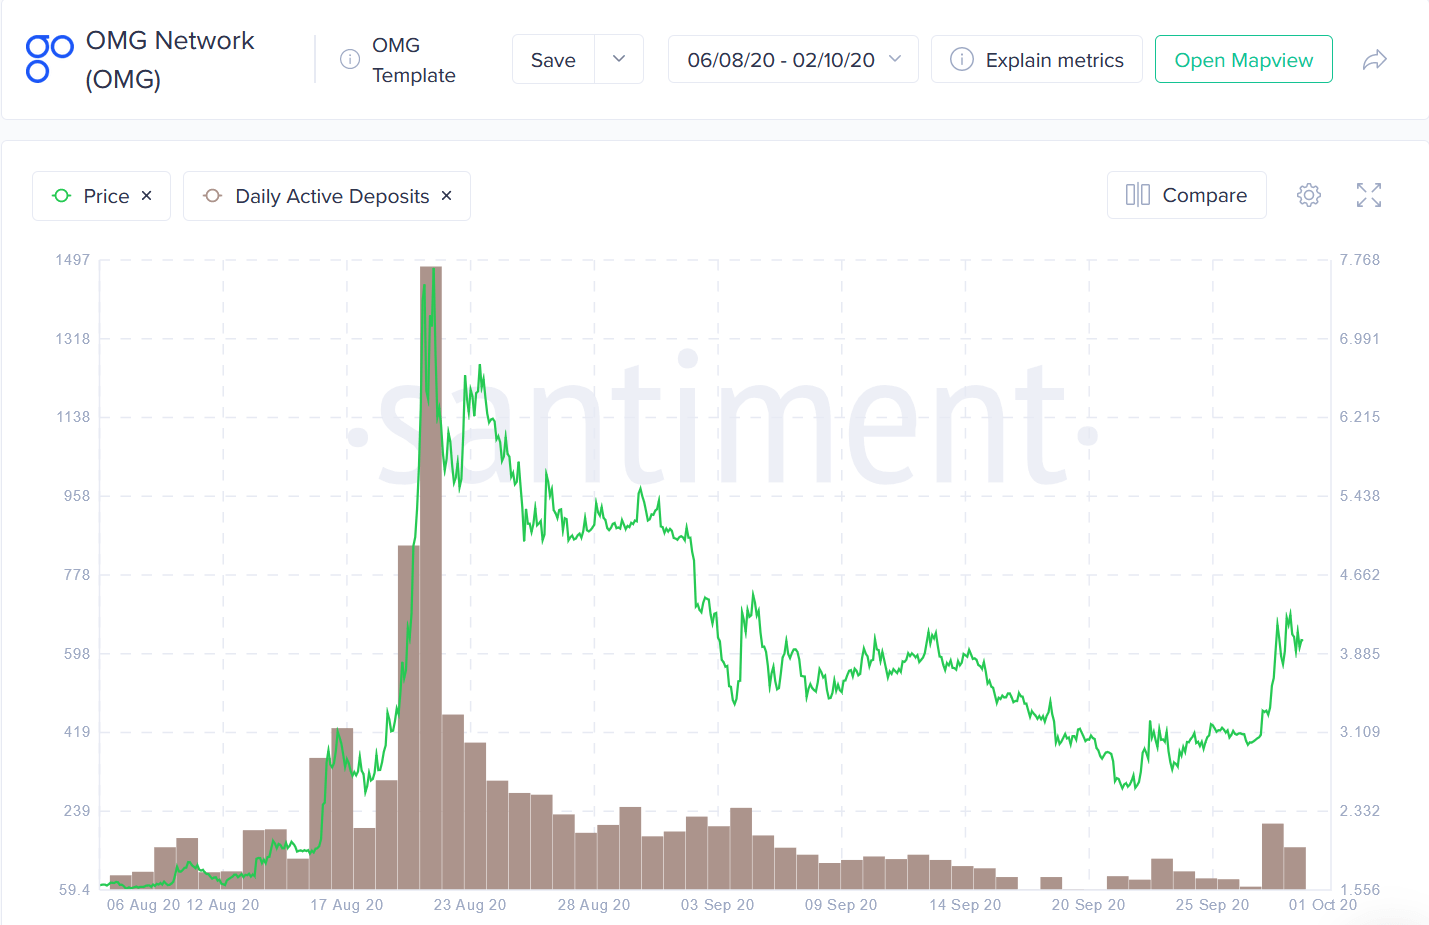
The number of OMG tokens sent to exchanges hit 418,000 now; however, the number of daily active deposits is around seven times lower, which would indicate that the scaling solution network will not experience a large selloff.
More positive metrics in favor of OMG
The report continues pointing out other positive on-chain metrics favoring the bulls. For instance, the number of OMG-related mentions on social media has been going up recently, although it remains significantly lower than the uptick in August.
According to Santiment, the growing trend would ‘allow the price to still grow further before we see a strong correction,’ but caution is advised.
OMG/USD daily chart
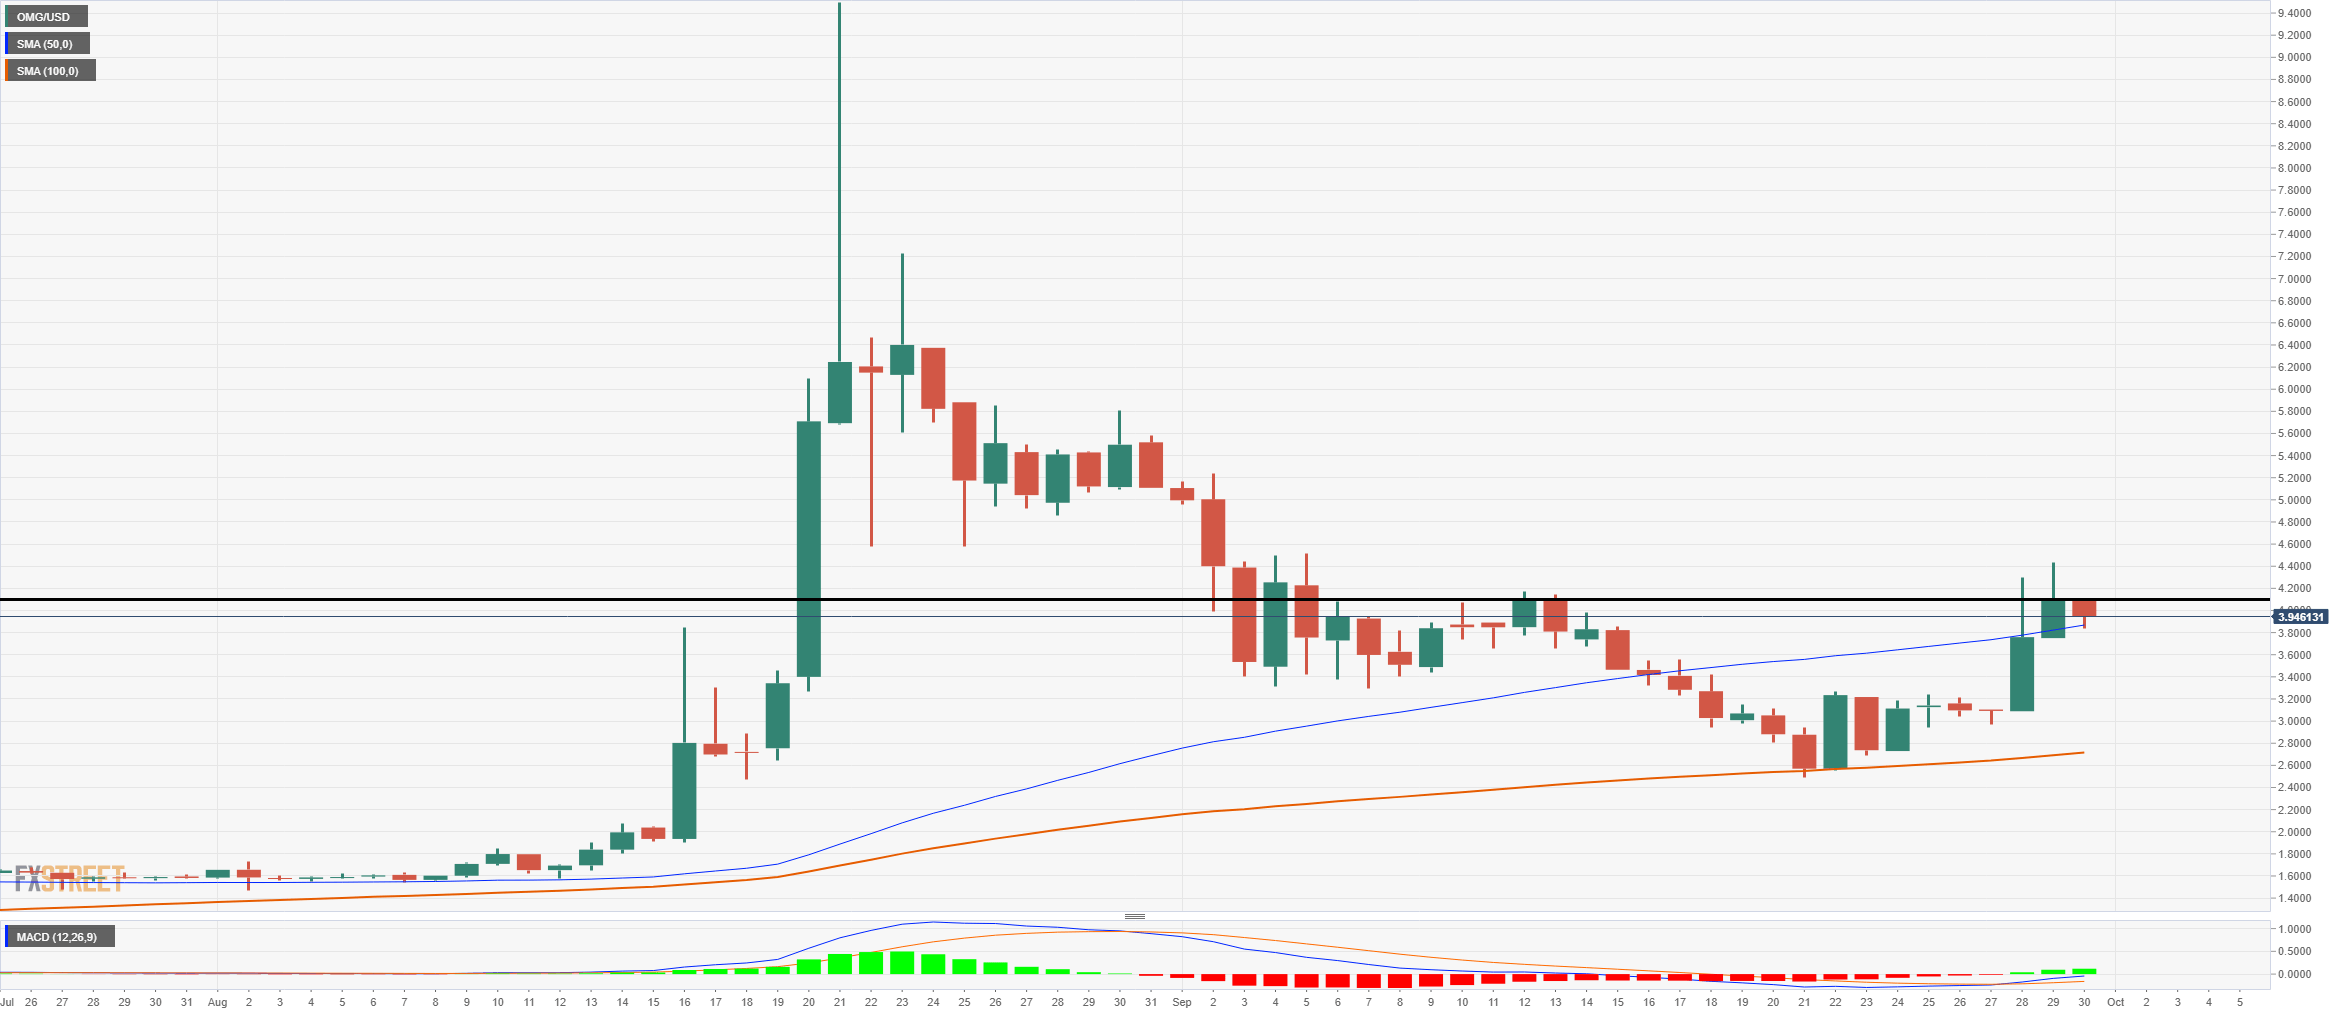
One of the most positive indicators for OMG on the daily chart is that the price climbed above the 100-MA and turned it into support. Similarly, the 50-MA was also conquered as support and is being re-tested currently. Furthermore, the MACD turned bullish on September 28 for the first time since August 10. The last time, the price of OMG exploded 300% in less than ten days.
OMG New Addresses
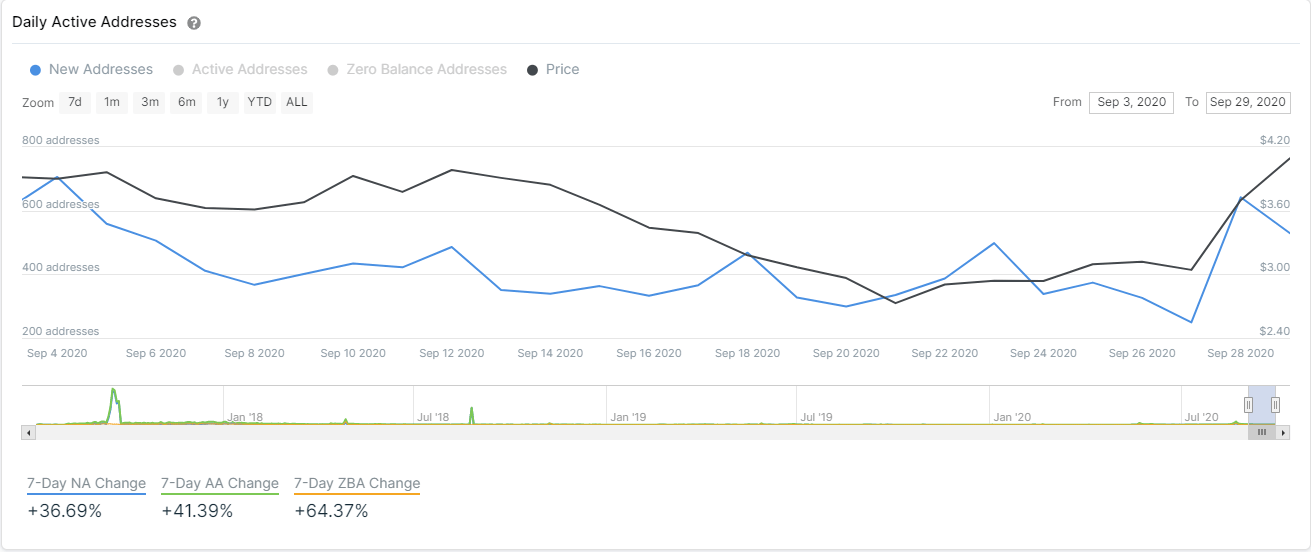
Another metric in favor of the bulls is the number of new addresses joining the network. On September 28, this metric saw a notable spike, far above the last high at 498 addresses with 642 now. An increase usually represents an increase in interest from investors, a bullish sign.
OMG IOMAP Chart
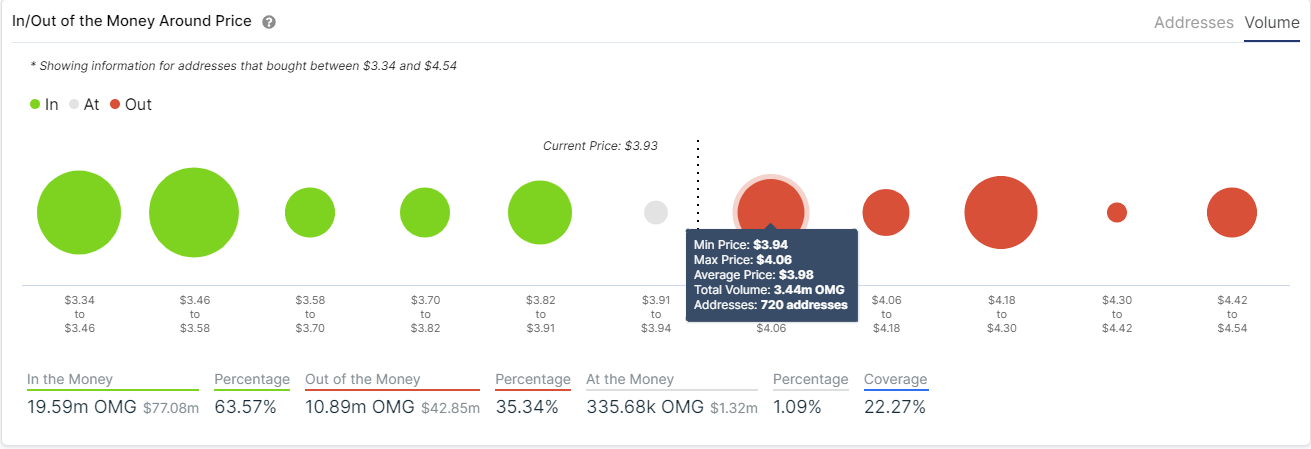
However, it’s important to note that a strong resistance level has been established at around $4.10, which has rejected the price on several different occasions. The In/Out of the Money Around Price chart by IntoTheBlock also shows a notable amount of resistance between $3.94 and $4.06, where 720 addresses bought 3.4 million OMG coins.
On the other side, the range between $3.82 and $3.91 is acting as a support area; however, a bearish breakout below this area will take OMG down to $3.58, where the next notable support area was established.
Author

Lorenzo Stroe
Independent Analyst
Lorenzo is an experienced Technical Analyst and Content Writer who has been working in the cryptocurrency industry since 2012. He also has a passion for trading.


