NEO Price Prediction: NEO poised for a massive correction eyeing $16
- NEO rejected at the 100 SMA, falling into the bears’ hands.
- Support at the 50 SMA is key to resuming the uptrend, but NEO could extend the losses if broken.

NEO recently found formidable support at $16. Buyers took advantage of the demand to enact a recovery that saw the altcoin trade above the crucial level at $18. However, a descending trendline rejected the price, leaving the psychological resistance at $20 untested. Meanwhile, NEO/USD has retreated to $17.85 amid a developing bearish momentum.
NEO resumes the downtrend as $16 beckons
From a technical perspective, NEO is in the middle of a retreat mission. Its upside is capped by the descending trendline, as mentioned in conjunction with the 100 Simple Moving Average in the 4-hour timeframe. The Relative Strength Index (RSI), although not oversold, is also moving sharply towards the midline.
NEO is likely to continue with the declines, especially if the RSI slides below the average. The 50 SMA is in line to absorb some of the selling pressure. In case the moving average support gives in, NEO may well breakdown further, resting support at $16.
NEO/USD 4-hour chart
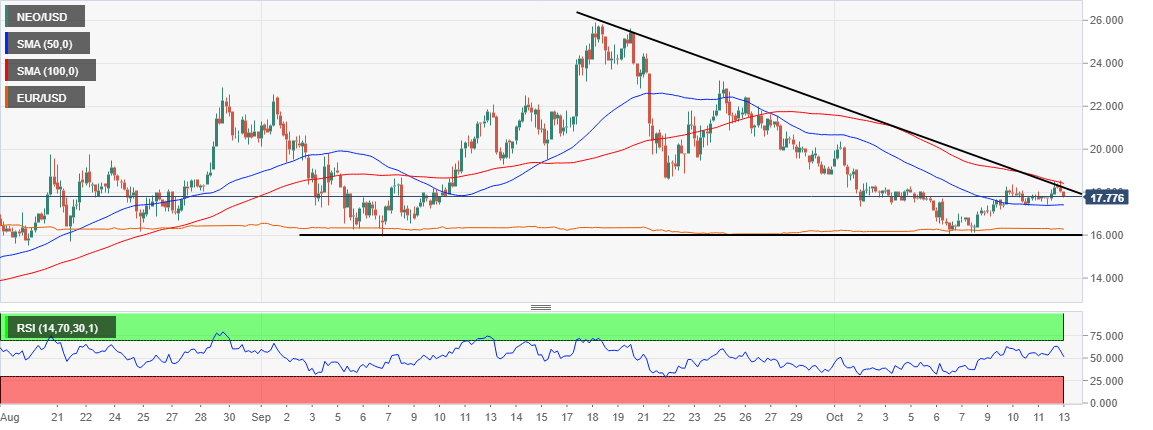
A descending triangle pattern in the same 4-hour timeframe gives credibility to the potential breakdown. This pattern is bearish and is formed by joining a series of lower highs with a trendline. Another trendline is drawn horizontally, connecting a series of lows.
Usually, breakouts under the support trendline are anticipated. NEO’s near future looks bleak, mostly if the triangle support is broken. In other words, losses have the potential to continue in the short term.
The hourly chart shows NEO struggling to hold above a short term but critical ascending trendline. On the upside, supply at the 50 SMA is limiting price action. Action beneath the trendline might retest tentative support at $17.50. The 200 SMA will also provide anchorage in a bid to avert possible losses to $16. It is essential to note that the bearish narrative is given credence by the Moving Average Convergence Divergence (MACD) as it grinds into the negative territory.
NEO/USD hourly chart
-637381572301418344.png)
Looking at the other side of the picture
It is worth mentioning that if the 50 SMA in the 4-hour timeframe holds firmly as support, the bearish narrative will be invalidated. A breakout above the descending trendline will also place NEO in a trajectory towards $20.
Author

John Isige
FXStreet
John Isige is a seasoned cryptocurrency journalist and markets analyst committed to delivering high-quality, actionable insights tailored to traders, investors, and crypto enthusiasts. He enjoys deep dives into emerging Web3 tren


