NEO Price Prediction: NEO is on the verge of a significant price explosion
- NEO is currently trading at $17.95 after a pullback from 2020-high at $25.85.
- Several indicators are showing bullish signs in the short-term for the digital asset.

NEO is down 12% since the beginning of October and continues trading inside a downtrend. Despite the launch of Flamingo, a decentralized finance protocol built on top of NEO’s blockchain, the price of the digital asset has continued to drop.
NEO price is close to a massive move
Several key indicators are showing that NEO is on the verge of a spike. If we take a look at the daily chart, we can recognize an ‘8’ presented by the TD sequential indicator, a sign that a buy signal will come up soon.
NEO/USD daily chart
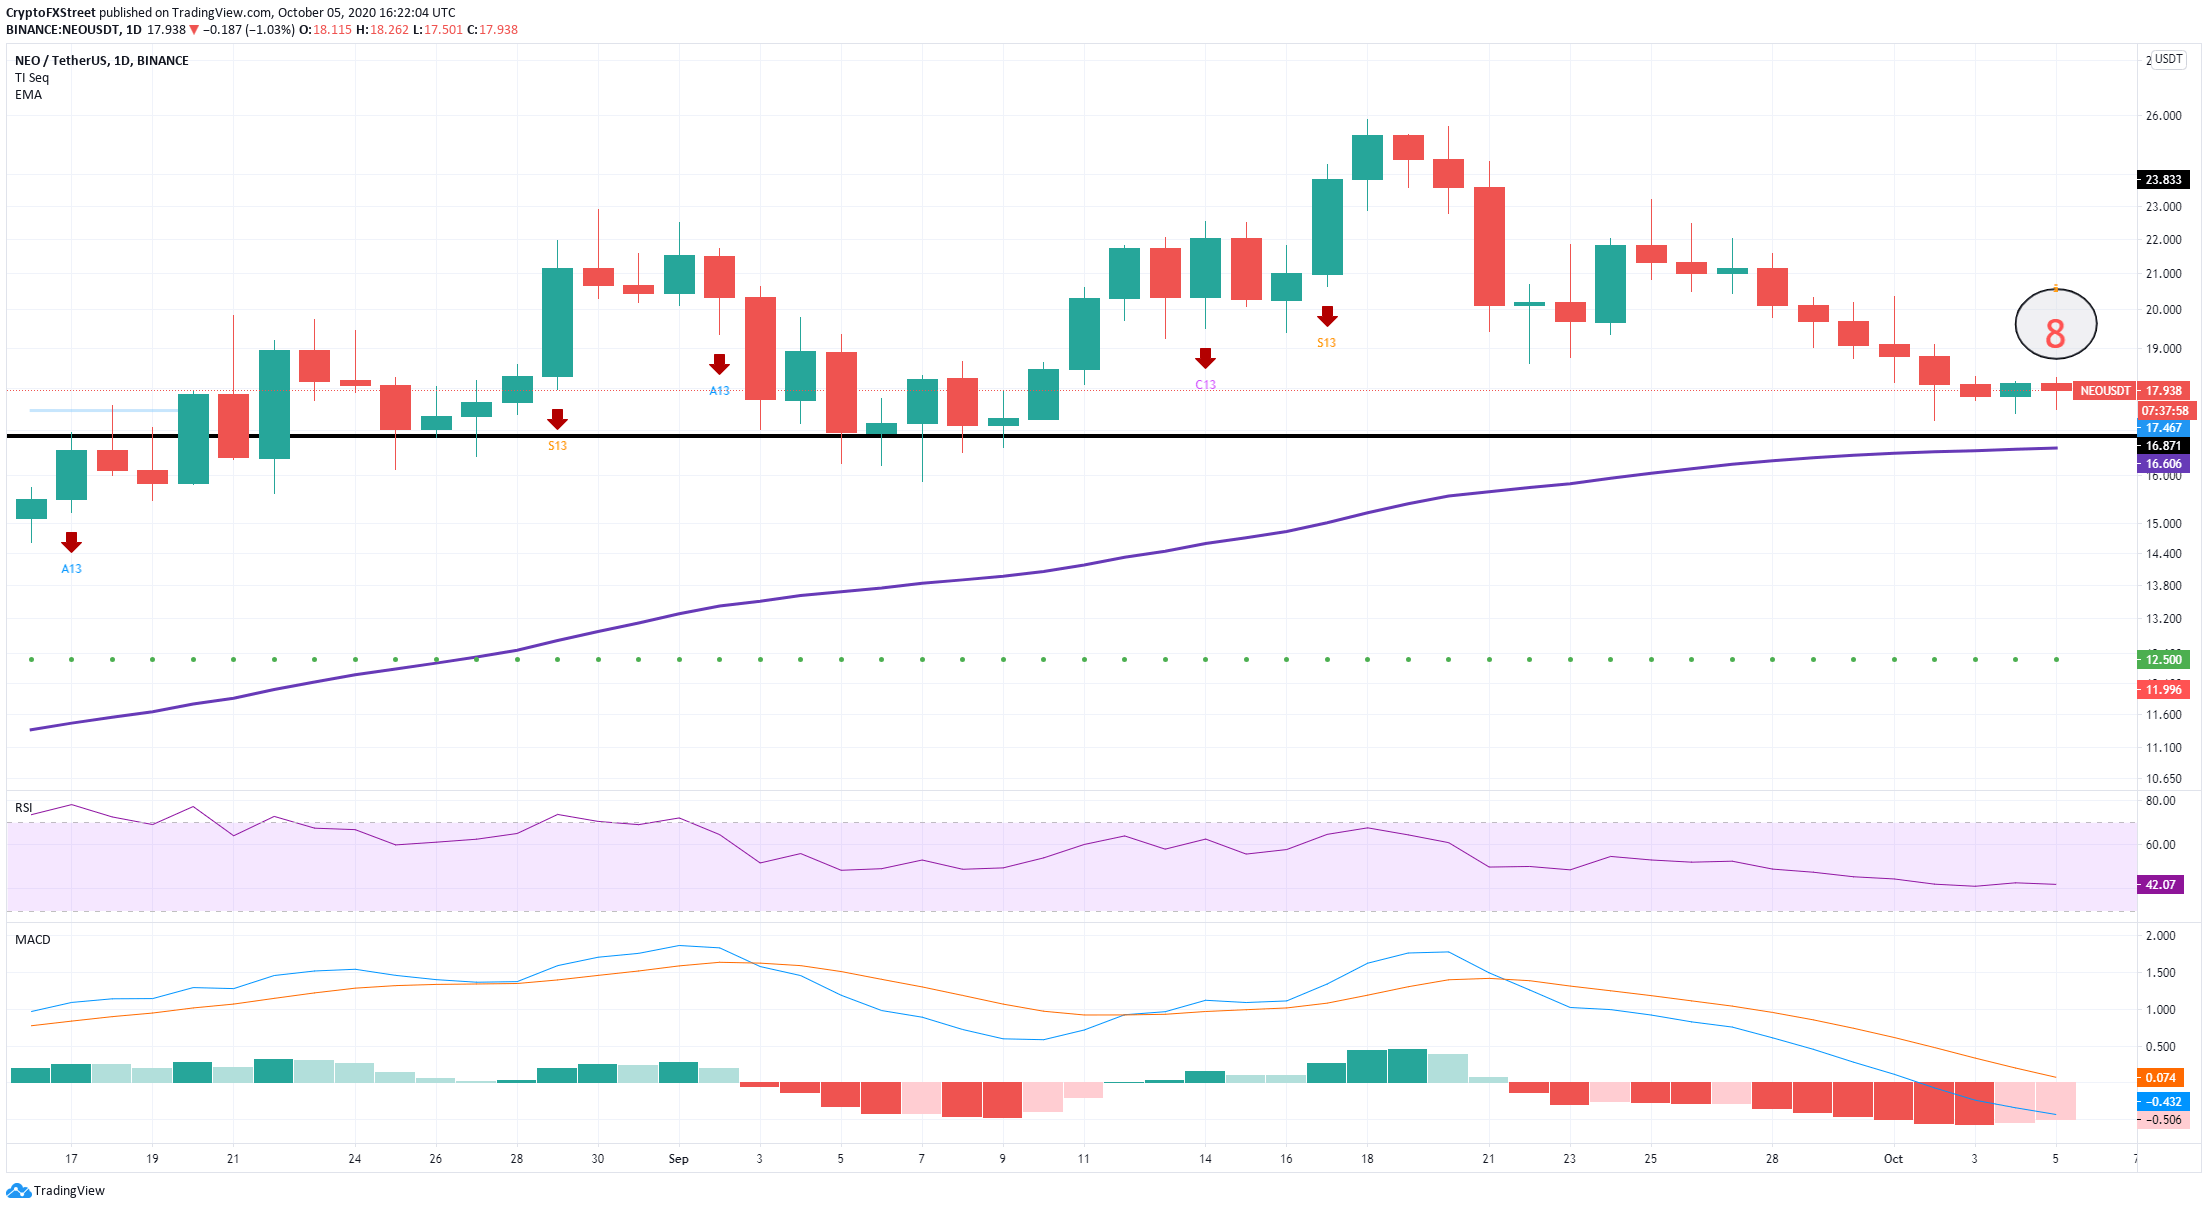
The price of NEO is at $17.94, right above an important support level formed at $16.9. This level was defended on several occasions in the past on September 6 and August 25.
Another crucial factor showing the upcoming volatility for NEO is the Bollinger Bands indicator. The bands are squeezing on the 4-hour chart, which usually means that a significant price movement is underway. Breaking through the upper band of the indicator will most likely push NEO up to $20.
NEO/USD 4-hour chart
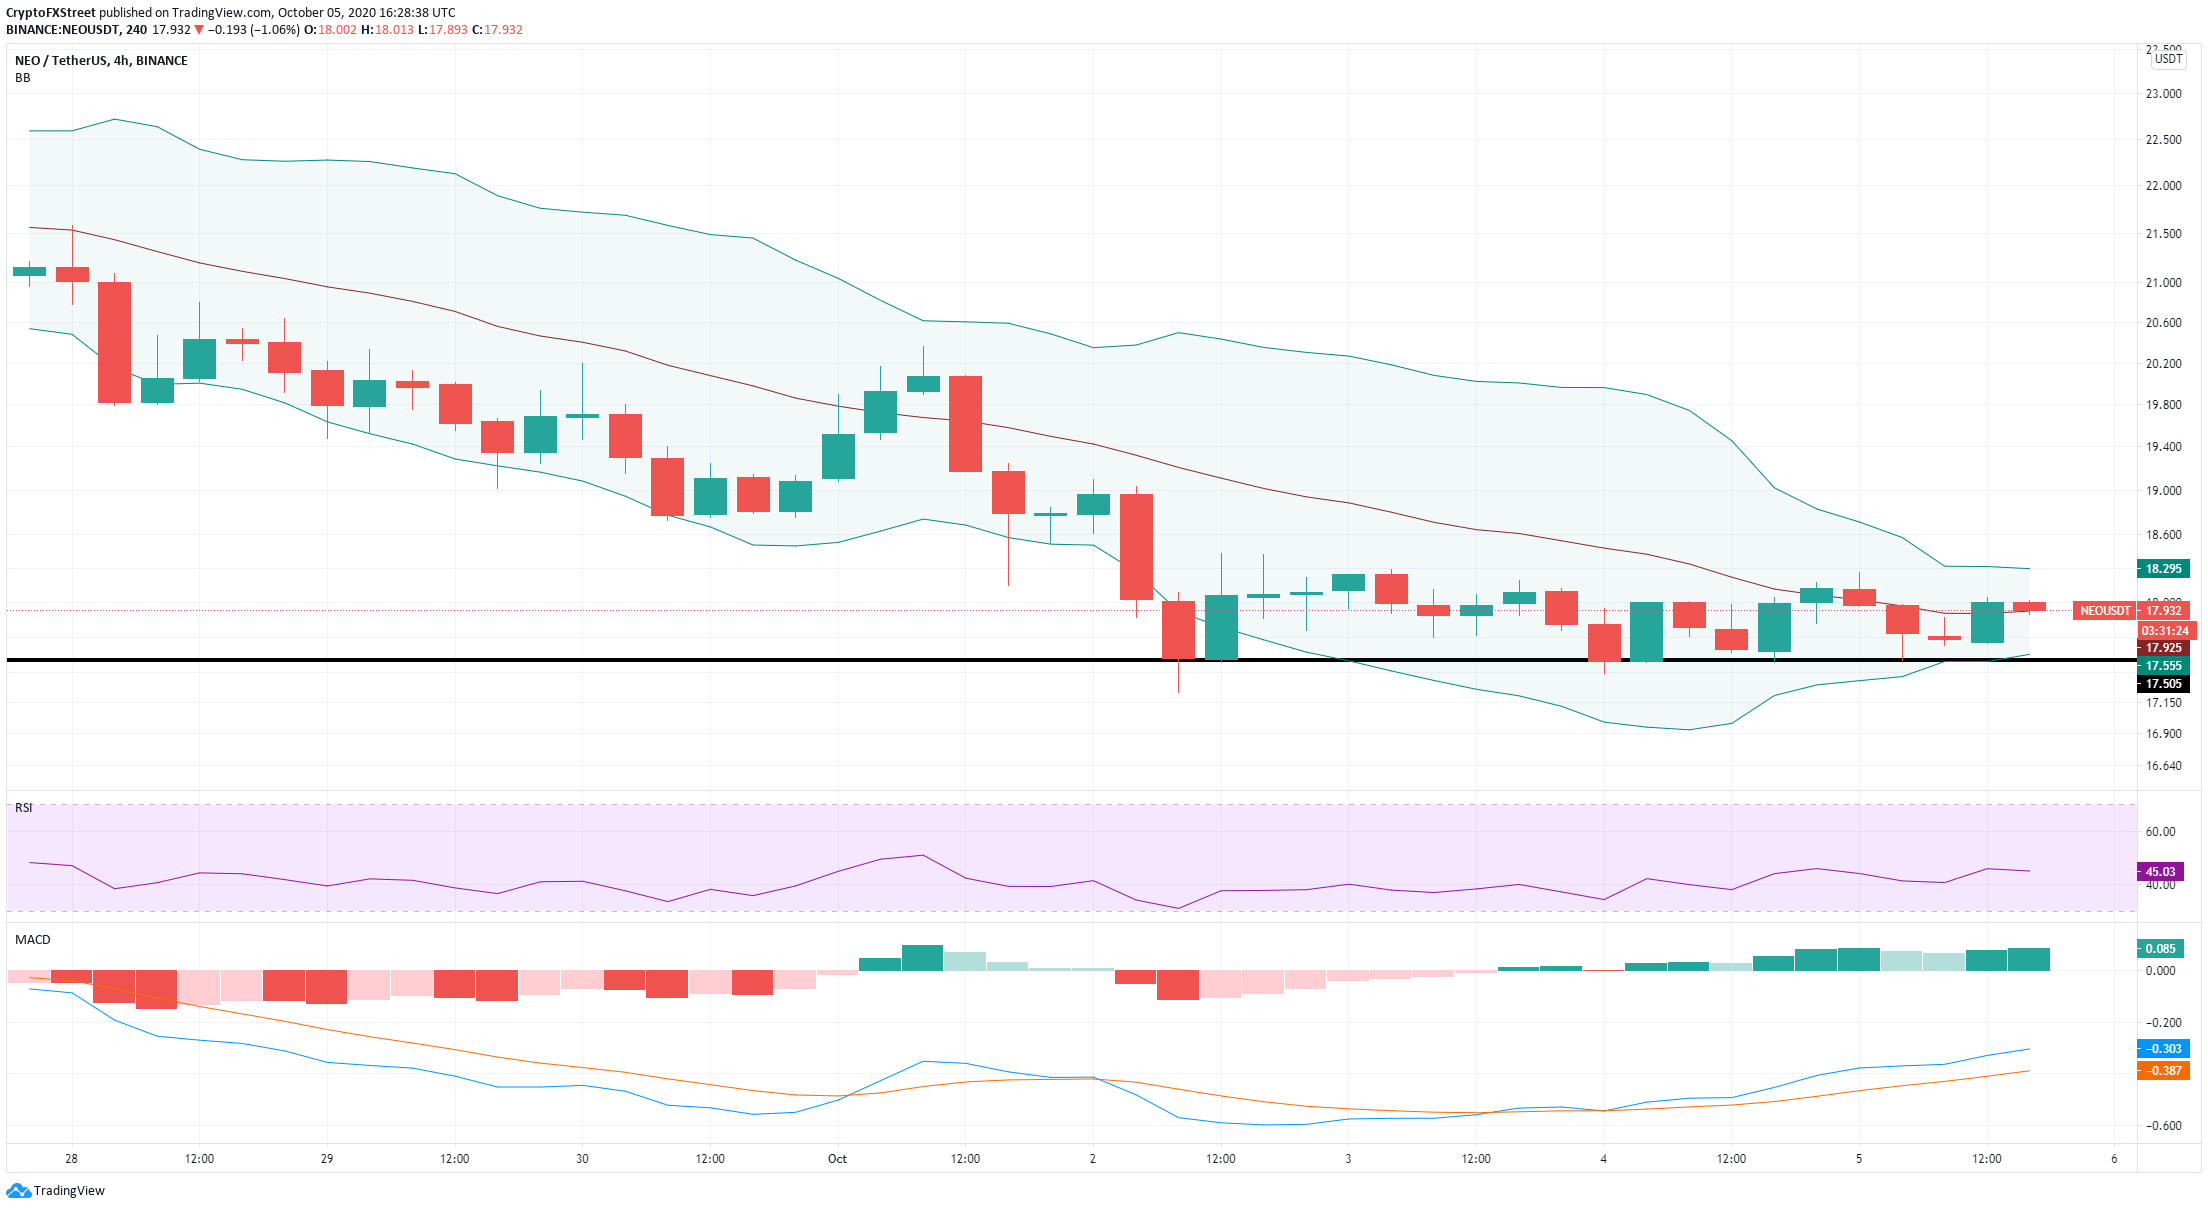
NEO also formed a healthy support level at $17.5 on the 4-hour chart while the MACD turned bullish on October 3, indicating that bulls are in control over the short-term.
However, a bearish breakout below $17.5 would most likely bring NEO down to the daily 100-EMA at $16.6. Furthermore, it seems that on the hourly chart, the digital asset is getting rejected from the 100-SMA.
NEO/USD 1-hour chart
-637375122708501725.png)
The 100-SMA, currently established at $18, acted as a strong resistance level several times in the past on October 1 and September 27.
Author

Lorenzo Stroe
Independent Analyst
Lorenzo is an experienced Technical Analyst and Content Writer who has been working in the cryptocurrency industry since 2012. He also has a passion for trading.



