NEO Price Forecast: NEO poised for a remarkable rebound to $25
- NEO succumbed to intense selling pressure after trading September highs at $26.
- Recovery from the support at $18.50 is dealing with resistance at $20 as well as the descending trendline.
- A possible breakout to $25 depends on NEO's ability to hold above the 50-day SMA.

Over the past couple of weeks, NEO has been on a retreat from highs around $26. As the bearish wave swept through the market, bulls tried their best to hold NEO above various key support levels at $22 and $20 but failed. NEO/USD extended the bearish leg under $20 and refreshed the levels close at $18.50. A bounce from the support lost steam marginally above $22, giving way for another slump to $18.50. At the time of writing, NEO bulls nurture an uptrend, reflected by the minor recovery to levels slightly above $19.
User-friendly account names coming to NEO
Interacting with cryptocurrencies requires the creation of an account by generating a cryptographic keypair. Unfortunately, these keypairs carry with them usability challenges. For instance, users must guarantee the safety of private keys or risk losing all their holdings. The private keys are also associated with seed words that are a bit complex and could be misplaced. In other words, it can be an uphill task interacting with cryptocurrencies.
NEO's development team is currently "working on a native domain service to improve this design." The upgrade will give users the ability to "map their addresses into easy-to-use domain names." The main goal is to have user-readable addresses that represent the public keys.
NEO's bullish outlook to $25
NEO is seating comfortably above the 50-day Simple Moving Average (SMA). This is a key level on the daily chart. NEO has not traded below indicator since mid-August. It took NEO/USD almost two months to hit highs of $26. With the price holding above the 50 SMA, the crypto might resume the rally, with a target at $25.
NEO/USD daily chart

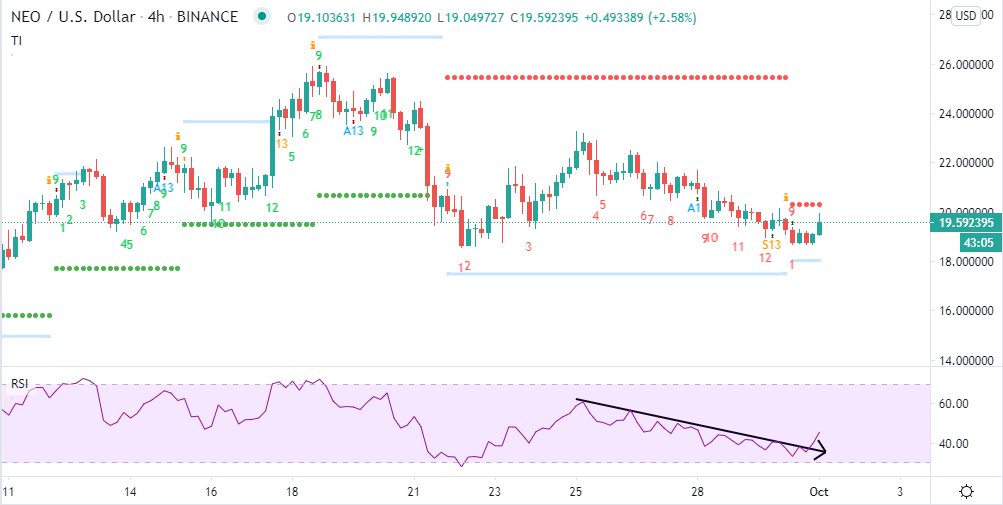
The TD Sequential indicator already presented a buy signal in the form of a red nine candlestick in the 4-hour range. Moreover, the Relative Strength Index (RSI) in the same timeframe has resumed the uptrend, highlighting the presence of buying pressure. Continued uptrend towards the overbought area would occur in tandem with the NEO/USD rise above $20 and $22, respectively.
NEO/USD 4-hour chart
According to Santiment, a leading provider of on-chain analysis, NEO's social volume shot up to 1,700 on September 20 when the token traded highs around $26. The social volume has since done down to 8 alongside the breakdown of the price to $18.50. The low volume opens the door for future spikes as well as price rally.
NEO social volume chart
 social volume chart-637371212784072986.png)
Looking at the other side of the picture
NEO is dealing with the resistance at $20. A break above this seller congestion zone would boost the token above the descending trendline, raising the price towards $25. However, if the daily candlestick closes below the 50-day SMA, the next level of support would be the 100-day SMA around $15. The critical support range between $16 and $18 will also absorb the selling pressure, probably halting the potential slide to $15.
Author

John Isige
FXStreet
John Isige is a seasoned cryptocurrency journalist and markets analyst committed to delivering high-quality, actionable insights tailored to traders, investors, and crypto enthusiasts. He enjoys deep dives into emerging Web3 tren