Monero price falls below $150 as Kraken delists XMR in Europe amid regulatory changes
- Monero’s price fell by more than 10% following Kraken’s announcement that it is delisting XMR trading in Europe.
- Monero’s price broke below its key support level at $152.83 on Tuesday, signaling the continuation of the bearish trend.
- XMR’s long-to-short ratio supports the bearish outlook, but a close above $156.48 would increase the chances of recovery.

Monero (XMR) shows weakness trades in the red on Wednesday after losing over 6% the previous day. XMR dipped more than 10% at some point on Tuesday following Kraken’s announcement that it is delisting XMR trading in Europe, which supported this bearish move. Additionally, XMR’s long-to-short ratio shows that more traders anticipate the fall of the Monero price.
Monero delists from Kraken exchange in European countries
On Tuesday, Kraken Exchange announced to its users that it would be delisting Monero from the European Economic Area (EEA) due to regulatory changes. As a result, Monero closed more than 6% down on Tuesday, registering as much as 10% losses earlier in the day.
Kraken said, “On October 31, we will halt trading and deposits of all XMR markets (XMR/USD, XMR/EUR, XMR/BTC, XMR/USDT) for clients registered in the EEA. Any open XMR orders will also be automatically closed at this time.”
It continued that the deadline for withdrawing XMR is December 31. If any clients still hold an XMR balance after this date, they will have their XMR automatically converted to BTC by Kraken at the going market rate.
Monero price action shows weakness
Monero price broke below the descending trendline (drawn by joining multiple lows from early August) on September 24 and declined 14.5% in one week. On Tuesday, it also closed below its 61.8% Fibonacci retracement level at $152.83 (drawn from an early August low of $135.98 to its September high of $180.10). At the time of writing on Wednesday, it continues trading down around $144.96.
If the 61.8% Fibonacci retracement level at $152.83 holds as resistance, it could continue its decline to retest the August 5 low of $135.98.
The Moving Average Convergence Divergence (MACD) indicator further supports Monero’s decline and signals a bearish crossover on the daily chart. It also shows rising red histogram bars below the neutral line zero, suggesting the continuation of strong bearish momentum.
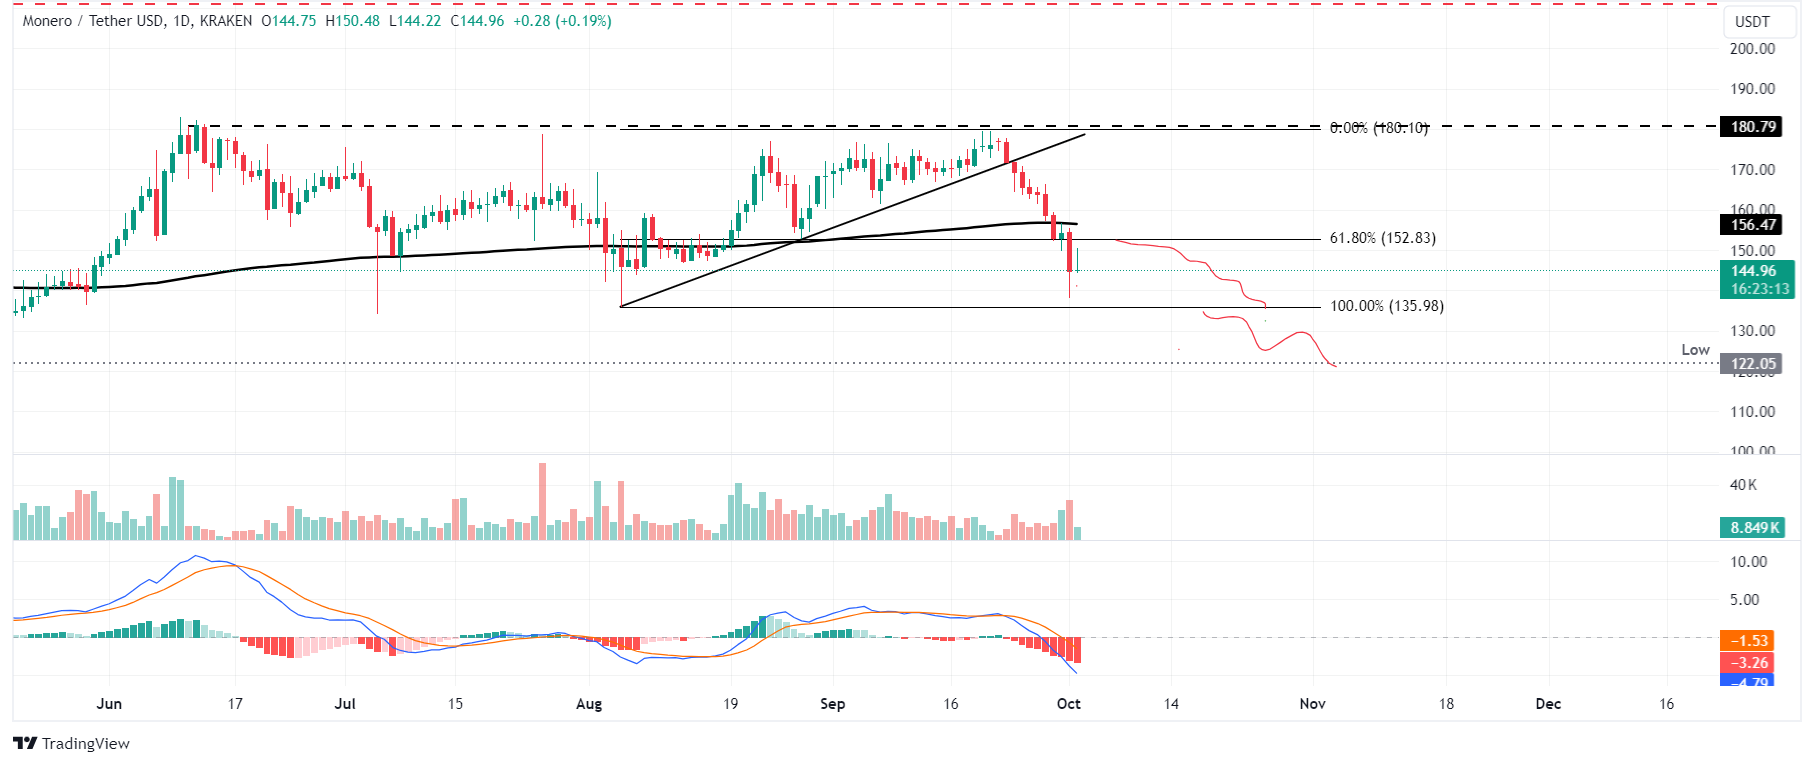
XMR/USDT daily chart
Coinglass’s long-to-short ratio further supports Monero’s bearish outlook, standing at 0.9. This ratio below one reflects bearish sentiment in the market, as more traders are betting for the asset price to fall.
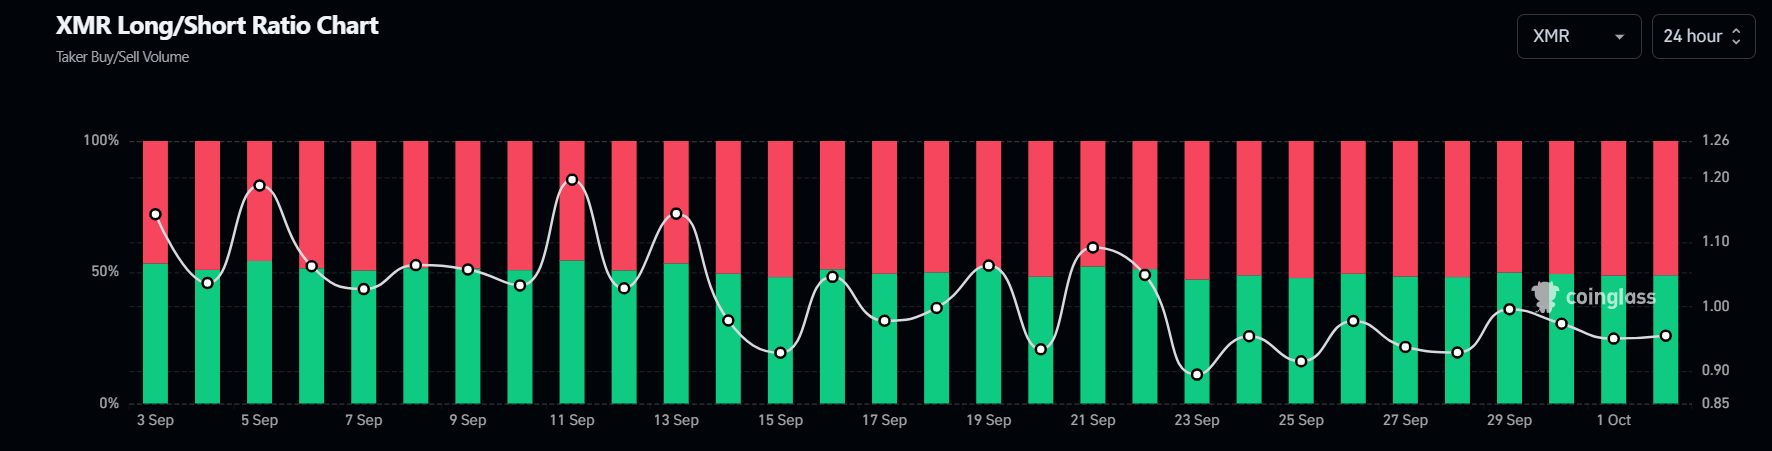
Monero long-to-short chart
Despite Monero’s delisting from the Kraken exchange, bearish price action and weak on-chain metric, the bearish outlook would be invalidated if Monero’s daily candlestick breaks above $152.83 and closes above its 200-day EMA at $156.47. This scenario could lead to a rise in Monero’s price to retest its next daily resistance at $180.79.
Author

Manish Chhetri
FXStreet
Manish Chhetri is a crypto specialist with over four years of experience in the cryptocurrency industry.




