- Monero price faces rejection from the daily resistance level of $180.79, eyeing a decline ahead.
- On-chain data paints a bearish picture as XMR’s long-to-short ratio is below one, the lowest level in one month.
- A daily candlestick close above $180.79 would invalidate the bearish thesis.
Monero (XMR), a privacy-centric cryptocurrency, continues to decline on Tuesday after facing rejection for resitance barrier on Monday. On-chain data hints at a bearish sentiment among XMR’s traders as its long-to-short ratio trades below one, suggesting a decline in Monero’s price ahead.
Monero price could react lower off key resistance
Monero's price has retested and faced difficulties multiple times around its daily resistance level of $180.79 since September 20, which declined 2.78% on Monday. As of Tuesday, it continues to trade down at $169.13, breaking below the ascending trendline (drawn by joining multiple low levels from early August).
If the daily resistance at $180.79 continues to hold as resistance, and Monero closes below the ascending trendline, the drop could extend by 10% to retest its 61.8% Fibonacci retracement level at $152.73 (drawn from an early August low of $135.95 to its September high of $179.84).
The Moving Average Convergence Divergence (MACD) indicator further supports Monero’s decline, signaling a bearish crossover on the daily chart. The MACD line (blue line) has moved below the signal line (yellow line), giving a sell signal. It also shows red histogram bars below the neutral line zero, suggesting that Monero’s price could experience downward momentum.
Additionally, the Relative Strength Index on the daily chart trades at 48, below its neutral level of 50, and points downward. A cross to levels below the neutral level generally indicates bearish momentum is gaining traction.
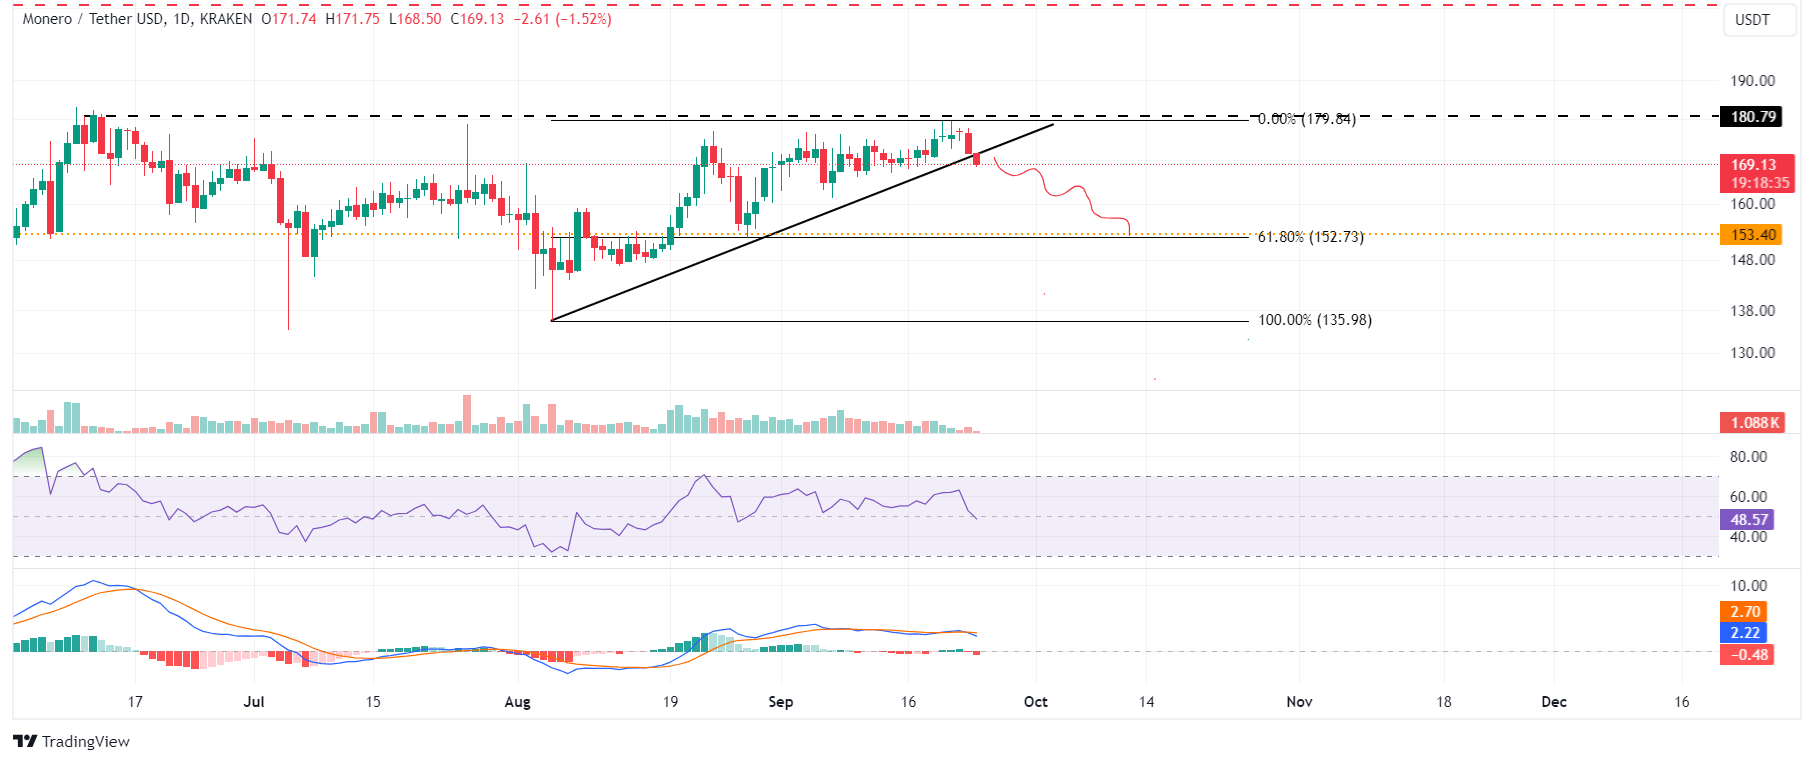
XMR/USDT daily chart
Monero’s On-chain data also supports a bearish outlook. Coinglass’s Monero long-to-short ratio is at 0.766, the lowest level in one month. This ratio below one reflects bearish sentiment in the market as more traders are betting for the asset price to fall.
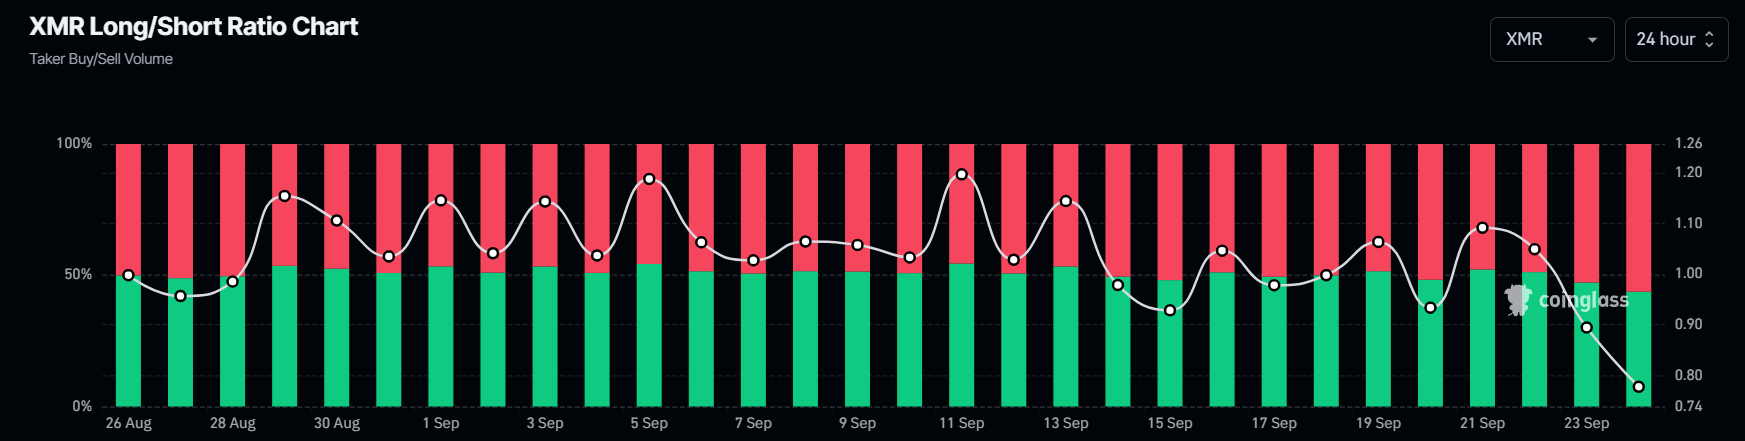
Monero long-to-short ratio chart
However, the bearish thesis would be invalidated if Monero’s daily candlestick breaks and closes above the daily resitance level of $180.79. This scenario could lead to a rise in Monero’s price to retest its psychologically important level of $190.
Information on these pages contains forward-looking statements that involve risks and uncertainties. Markets and instruments profiled on this page are for informational purposes only and should not in any way come across as a recommendation to buy or sell in these assets. You should do your own thorough research before making any investment decisions. FXStreet does not in any way guarantee that this information is free from mistakes, errors, or material misstatements. It also does not guarantee that this information is of a timely nature. Investing in Open Markets involves a great deal of risk, including the loss of all or a portion of your investment, as well as emotional distress. All risks, losses and costs associated with investing, including total loss of principal, are your responsibility. The views and opinions expressed in this article are those of the authors and do not necessarily reflect the official policy or position of FXStreet nor its advertisers. The author will not be held responsible for information that is found at the end of links posted on this page.
If not otherwise explicitly mentioned in the body of the article, at the time of writing, the author has no position in any stock mentioned in this article and no business relationship with any company mentioned. The author has not received compensation for writing this article, other than from FXStreet.
FXStreet and the author do not provide personalized recommendations. The author makes no representations as to the accuracy, completeness, or suitability of this information. FXStreet and the author will not be liable for any errors, omissions or any losses, injuries or damages arising from this information and its display or use. Errors and omissions excepted.
The author and FXStreet are not registered investment advisors and nothing in this article is intended to be investment advice.
Recommended Content
Editors’ Picks

Top 3 gainers Supra, Cosmos Hub, EOS: Supra leads recovery after Trump’s tariffs announcement
Supra’s 25% surge on Friday calls attention to lesser-known cryptocurrencies as Bitcoin, Ethereum and XRP struggle. Cosmos Hub remains range-bound while bulls focus on a potential inverse head-and-shoulders pattern breakout.

Bitcoin Weekly Forecast: Tariff ‘Liberation Day’ sparks liquidation in crypto market
Bitcoin price remains under selling pressure around $82,000 on Friday after failing to close above key resistance earlier this week. Donald Trump’s tariff announcement on Wednesday swept $200 billion from total crypto market capitalization and triggered a wave of liquidations.

Can Maker break $1,450 hurdle as whales launch buying spree?
Maker is back above $1,300 on Friday after extending its lower leg to $1,231 the previous day. MKR’s rebound has erased the drawdown that followed United States President Donald Trump’s ‘Liberaton Day’ tariffs on Wednesday, which targeted 100 countries.

Gold shines in Q1 while Bitcoin stumbles
Gold gains nearly 20%, reaching a peak of $3,167, while Bitcoin nosedives nearly 12%, reaching a low of $76,606, in Q1 2025. In Q1, the World Gold ETF's net inflows totalled 155 tonnes, while the Bitcoin spot ETF showed a net inflow of near $1 billion.

Bitcoin Weekly Forecast: Tariff ‘Liberation Day’ sparks liquidation in crypto market
Bitcoin (BTC) price remains under selling pressure and trades near $84,000 when writing on Friday after a rejection from a key resistance level earlier this week.

The Best brokers to trade EUR/USD
SPONSORED Discover the top brokers for trading EUR/USD in 2025. Our list features brokers with competitive spreads, fast execution, and powerful platforms. Whether you're a beginner or an expert, find the right partner to navigate the dynamic Forex market.