MATIC sets for a rally as Polygon Foundation confirms the migration date
- Polygon price breaks above a falling wedge pattern, suggesting a shift in market structure.
- The Polygon Foundation has officially announced September 4 as the migration date for MATIC to POL.
- On-chain data shows that the daily active addresses are rising and have recorded the highest this year.
- A daily candlestick close below $0.426 would invalidate the bullish move.

Polygon (MATIC) price has broken above a falling wedge pattern, indicating a shift in market structure from bearish to bullish. The Polygon Foundation officially announced on Thursday that September 4 is the migration date for MATIC to POL. On-chain data reveals a significant increase in daily active addresses, the highest recorded this year, signaling a forthcoming bullish momentum.
Polygon Foundation sets September 4 as MATIC to POL migration date
On Thursday, the Polygon Foundation announced via its social media platform X that the Matic project will migrate from the MATIC token to the new POL token on September 4. This upgrade aims to enhance security and operational efficiency within the Polygon ecosystem.
Moreover, converting MATIC to POL at a 1:1 ratio will establish POL as the primary asset for staking and transaction fees on the network. Positive community consensus and endorsements from influential figures such as Mark Cuban further bolster optimism surrounding MATIC. These developments suggest significant potential for growth and adoption within the project, presenting an appealing opportunity for crypto enthusiasts and investors.
SAVE THE DATE: MATIC → POL
— Polygon Foundation (@0xPolygonFdn) July 18, 2024
After community consensus, the long-awaited upgrade is set for September 4th
• Initial phase: POL replaces MATIC as the native gas and staking token for Polygon PoS
• Subsequent phases: POL will serve a crucial role in the AggLayer
More details pic.twitter.com/SyxsFAlOeZ
Polygon price shows potential for a rally following retest of key support level
Polygon price broke above a falling wedge pattern on July 13 and rose 3.3% over three days. This pattern was formed by joining multiple swing high and low levels with trendlines from late January to mid-July. At the time of writing on Friday, MATIC trades around $0.510, down by 1.37% in the day.
If the upper trendline of the falling wedge pattern holds as pullback support at around the $0.490 to $0.512 zone, which coincides with the daily support level, MATIC could rally 19%, targeting its next daily resistance of $0.589.
The daily chart's Relative Strength Index (RSI) has briefly slipped below the 50 mean level, while the Awesome Oscillator (AO) is on its way to crossing above its neutral level of zero.
If bulls are indeed making a comeback, both momentum indicators must regain their positions above their respective mean levels. This would add a tailwind to the recovery rally.
If the bulls are aggressive, the overall crypto market outlook is positive, and MATC closes above the $0.589 level, it could extend an additional 25% rally to retest its weekly resistance at $0.738.
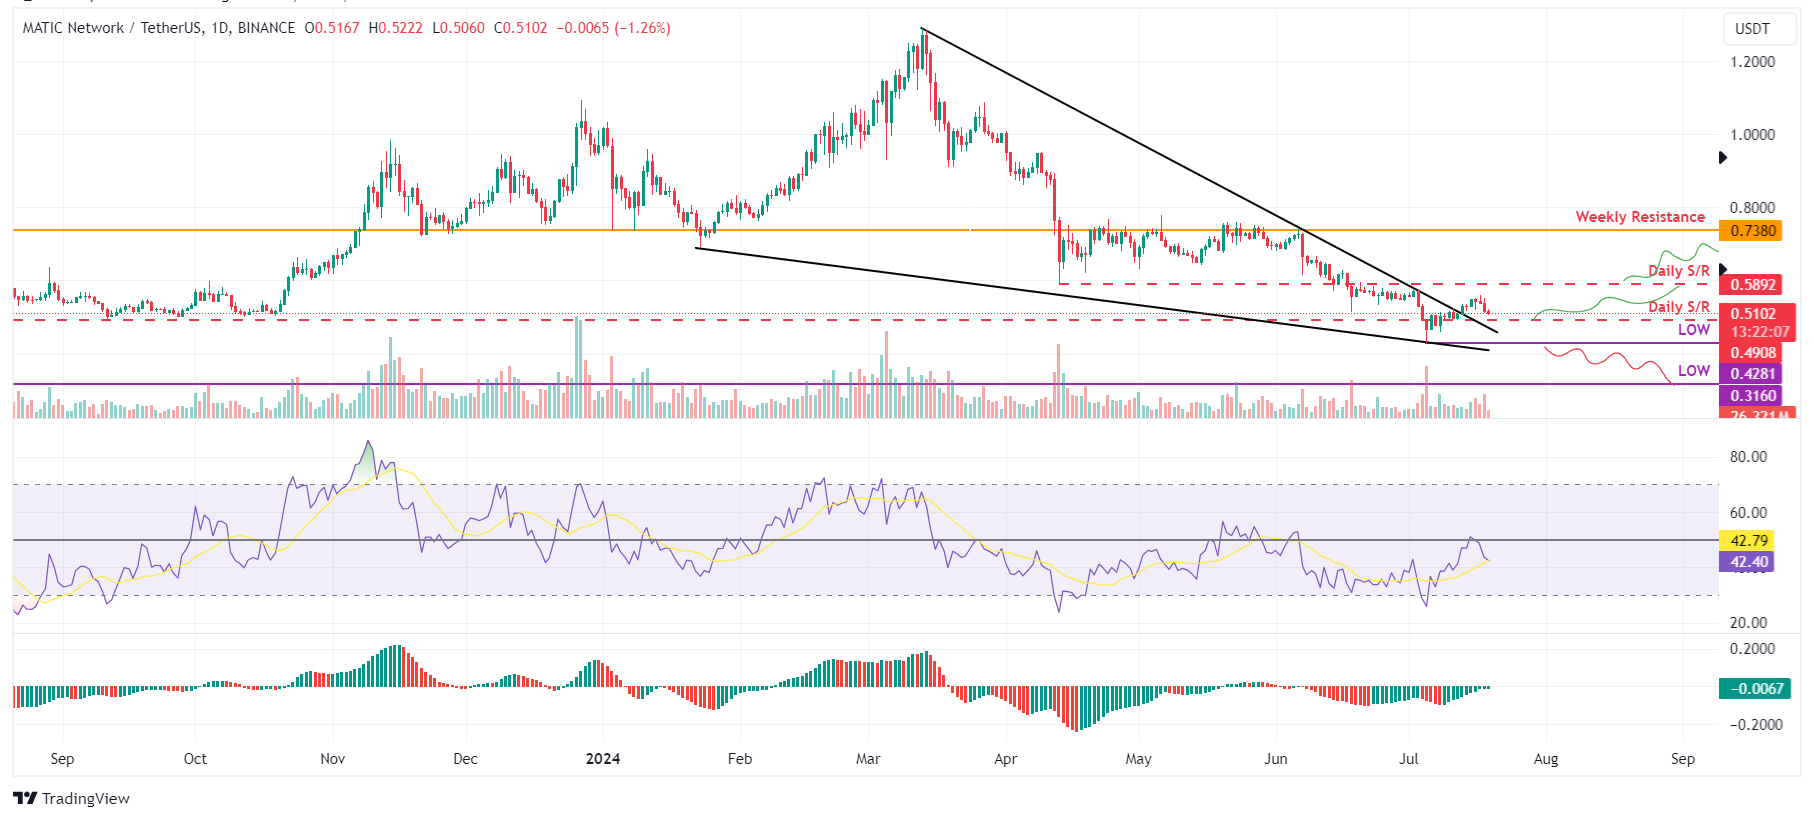
MATIC/USDT daily chart
Based on IntoTheBlock's In/Out of the Money Around Price (IOMAP), nearly 4,190 addresses accumulated 25.68 million MATIC tokens at an average price of $0.507. These addresses bought Polygon between $0.498 and $0.512, which makes it a key support zone.
Interestingly, the $0.498 to $0.512 zone mentioned from a technical analysis perspective coincides with the IOMAP findings, making this zone a key reversal area to watch.
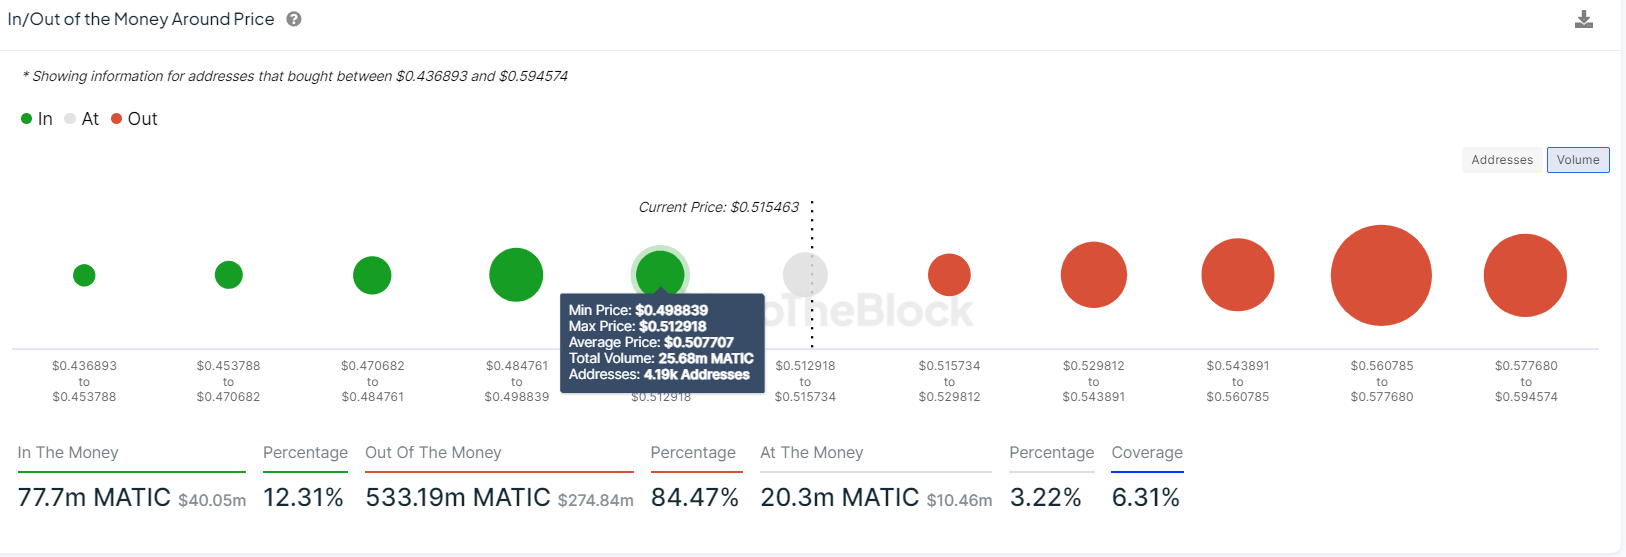
MATIC IOMAP chart
Santiment's Daily Active Addresses index, which helps track network activity over time, aligns with the bullish outlook noted from a technical perspective. A rise in the metric signals greater blockchain usage, while declining addresses point to lower demand for the network.
In Polygon's case, Daily Active Addresses have risen from 1,446 on Wednesday to 4,241 on Friday.This rise is the highest this year and indicates that demand for MATIC's blockchain usage is increasing, which could propel a rally in Polygon's price.
%20[12.46.07,%2019%20Jul,%202024]-638569901912902021.png)
MATIC Daily Active Addresses chart
Even though on-chain metrics and technical analysis point to a bullish outlook, if Polygon's price makes a daily candlestick close below $0.428, the bullish thesis would be invalidated by creating a lower low on the daily chart. This development could see MATIC's price crash by 25% to retest its daily low of $0.316 from June 18, 2022.
Author

Manish Chhetri
FXStreet
Manish Chhetri is a crypto specialist with over four years of experience in the cryptocurrency industry.


