Top 3 Price Prediction Bitcoin, Ethereum, Ripple: Bitcoin faces resistance around the $65,000 mark
- Bitcoin price experiences rejection as it meets resistance around the $65,000 level.
- Ethereum price faces resistance at $3,530, the 61.8% Fibonacci retracement.
- Ripple price could pause to the 61.8% Fibonacci retracement at $0.480 before continuing the bullish momentum.

Bitcoin (BTC) and Ethereum (ETH) prices encountered rejections upon reaching resistance levels near $65,000 and $3,530, respectively. Meanwhile, Ripple (XRP) price might undergo a pullback towards the 61.8% Fibonacci retracement level at $0.480 before potentially resuming its upward momentum.
Bitcoin price poised for pullback after retesting daily resistance at $65,000
Bitcoin price faced resistance near the daily level of $64,913 on Tuesday, leading to a 2% decline over the next two days. As of Friday, it is trading slightly lower by 0.25% at $63,819.
This level aligns closely with the 61.8% Fibonacci retracement level at $64,921, derived from the swing high of $71,997 on June 7 to the swing low of $53,475 on July 5, establishing a critical zone of resistance to monitor closely.
Sideline buyers seeking opportunities can consider positions between the $59,200 and $57,800 levels, where the previously broken trendline resistance now serves as support.
If BTC bounces off the $59,200 level, it could rise 9% to restest its daily resistance at $64,913.
On the daily chart, the Relative Strength Index (RSI) and the Awesome Oscillator (AO) reinforce the noted rebound, with both indicators positioned above their neutral thresholds of 50 and zero, respectively. This robust momentum signals a strong bullish sentiment in the market.
Furthermore, surpassing the $64,913 level could allow an additional 3.5% rise to retest its next weekly resistance at $67,209.
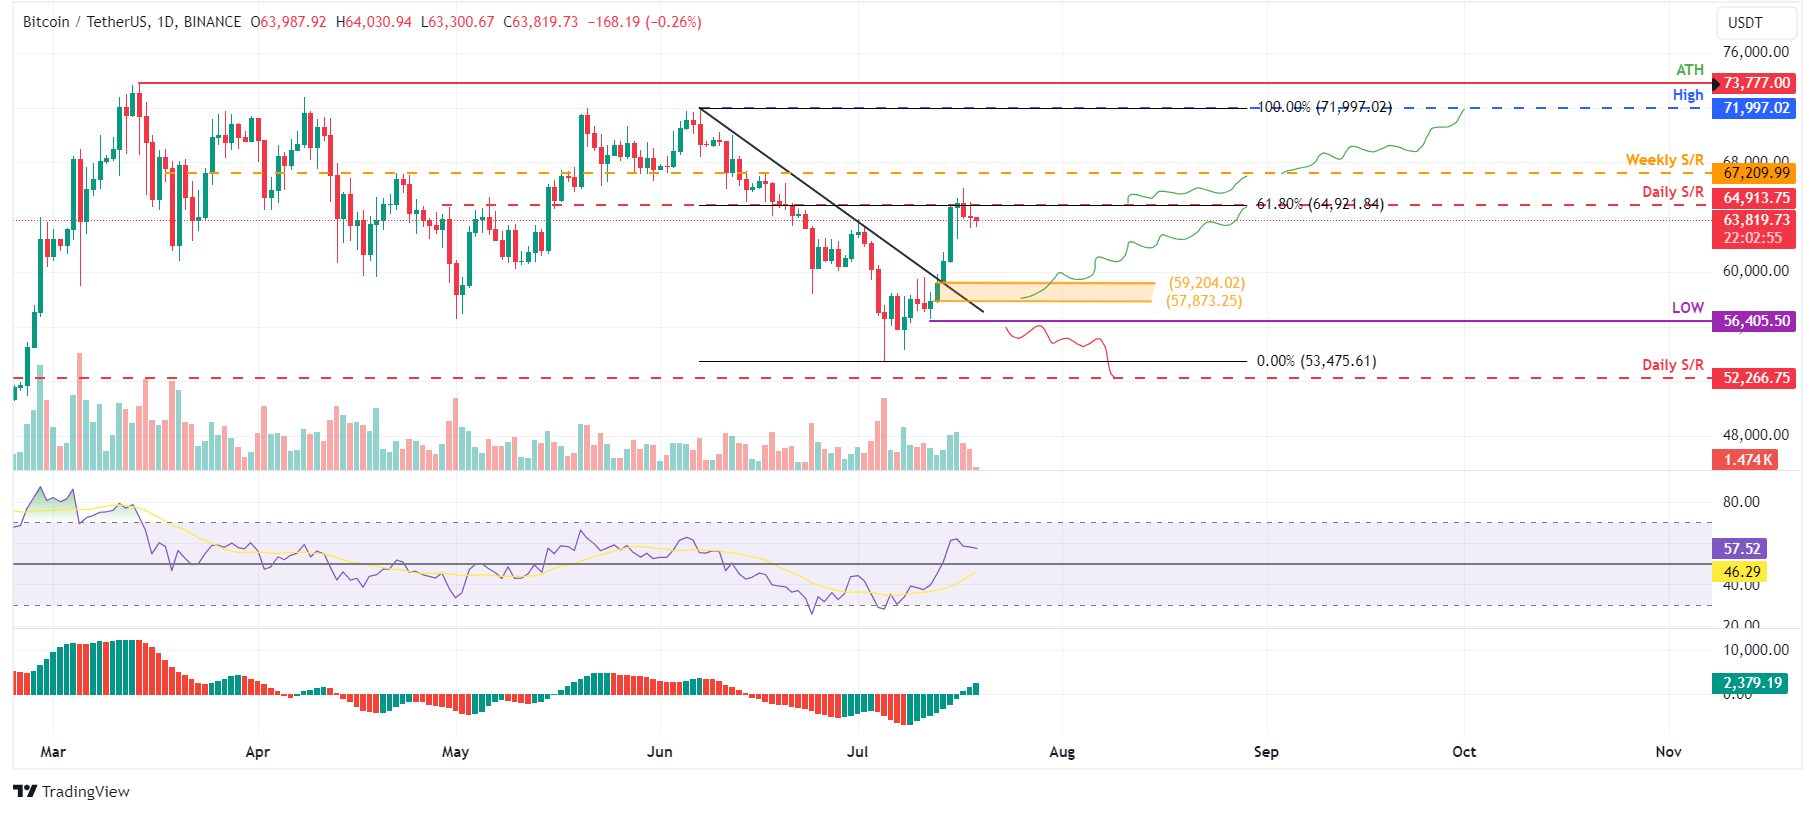
BTC/USDT daily chart
However, a close below $56,405 for BTC, accompanied by a formation of a lower low on the daily timeframe, could indicate sustained bearish sentiment. Such a scenario might precipitate a 7.5% decline in Bitcoin's price, potentially leading to a retest of its daily support level at $52,266.
Ethereum price encounters barrier at $3,530 mark
Ethereum price faces rejection at $3,530, 61.8% Fibonacci retracement level derived from the swing high of $3,977 on May 27 to the swing low of $2,808 on July 5. This level aligns closely with the daily high of $3,524 from July 1, establishing a critical zone of resistance to monitor closely. As of Friday, it trades slightly down 0.39% at $3,415.
If the $3,240 level holds as support, where the previously breached trendline resistance now acts as a supportive barrier, ETH could rise 8.6% to revisit its daily high of $3,524, set on July 1.
The Relative Strength Index (RSI) on the daily chart is trading above the neutral level of 50, and the Awesome Oscillator (AO) is on its way to doing the same. If bulls are indeed making a comeback, then both momentum indicators must maintain their positions above their respective mean levels. Such a development would add a tailwind to the recovery rally.
If the bulls are aggressive and the overall crypto market outlook is positive, ETH could close above the $3,524 level, extending an additional rally of 5.3% to retest its daily high set on June 9 at $3,721.
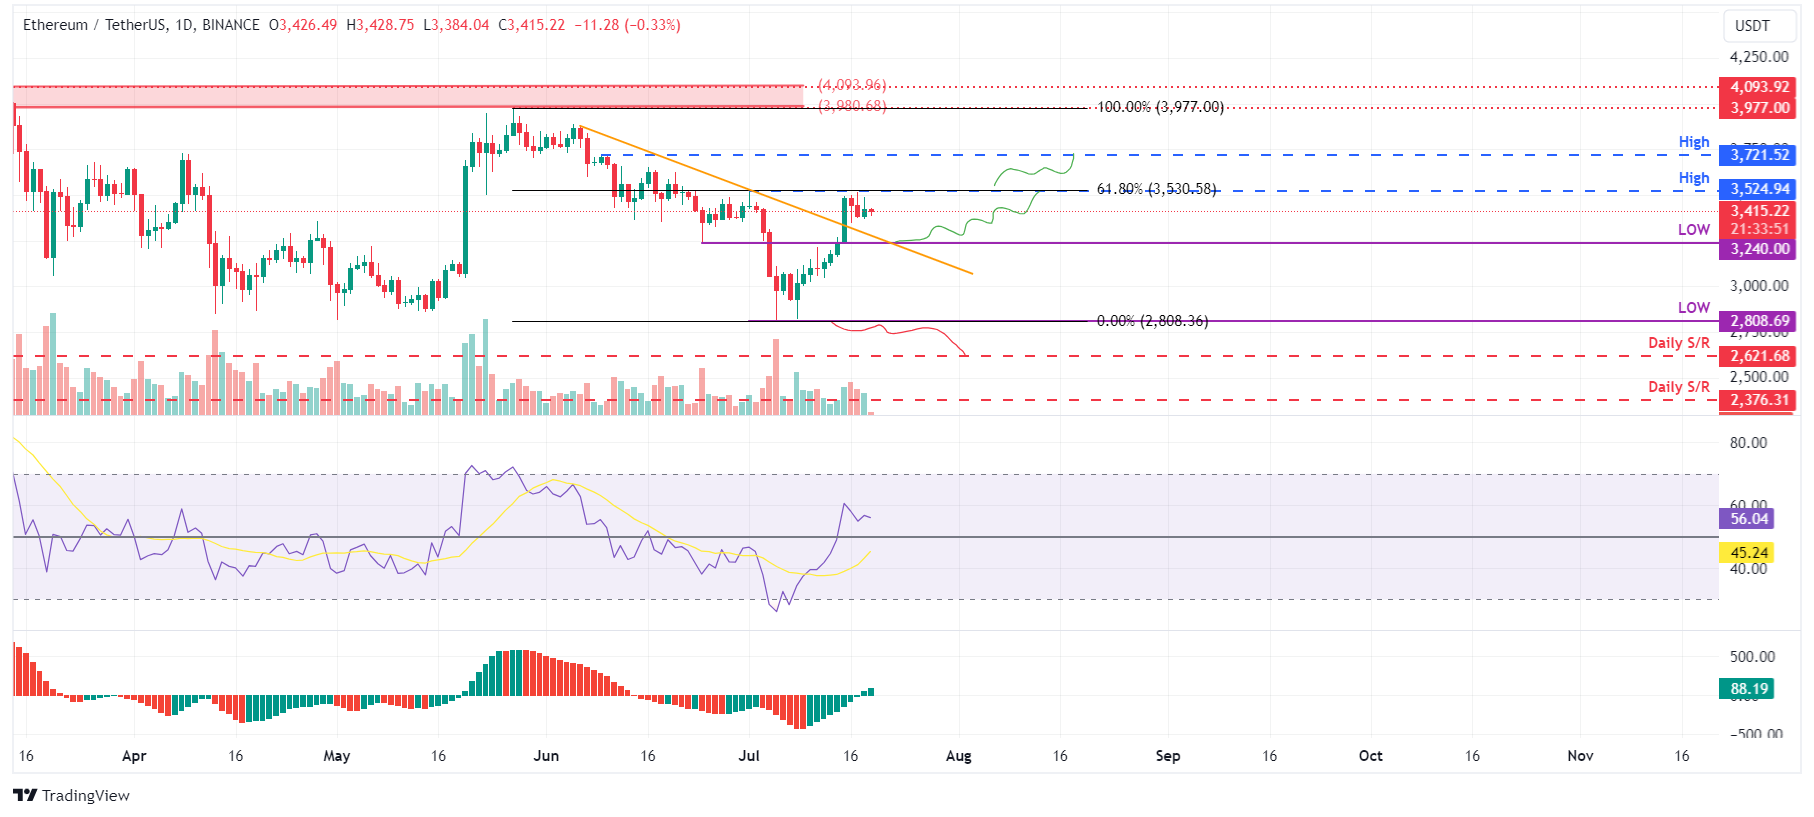
ETH/USDT daily chart
On the other hand, if Ethereum's daily candlestick closes below $2,808, forming a lower low in the daily timeframe, it may signal persistent bearish sentiment. This scenario could trigger a 7% decline in Ethereum's price, targeting a revisit of its daily support at $2,621.
Ripple price could resume rally if retest of key support at $0.480 succeeds
Ripple price broke above the daily resistance level at $0.499 on July 13 and rallied 20% over the next four days. Such strong upward momentum often precedes a retracement, presenting a potential buying opportunity for investors on the sidelines. As of Friday, it trades 3% down at $0.548 level.
Sideline buyers seeking opportunities can consider positions at $0.480, its 61.8% Fibonacci retracement level, derived from the swing low of $0.382 on July 5 to the swing high of $0.638 on July 17.
If XRP bounces off the $0.480 level, it could rally 33% to retest its daily high from April 9 at $0.643.
On the daily chart, the Relative Strength Index (RSI) is currently above the overbought level at 70, which supports the pullback above thesis. The Awesome Oscillator (AO) is above the mean level of zero. These momentum indicators strongly indicate bullish dominance.
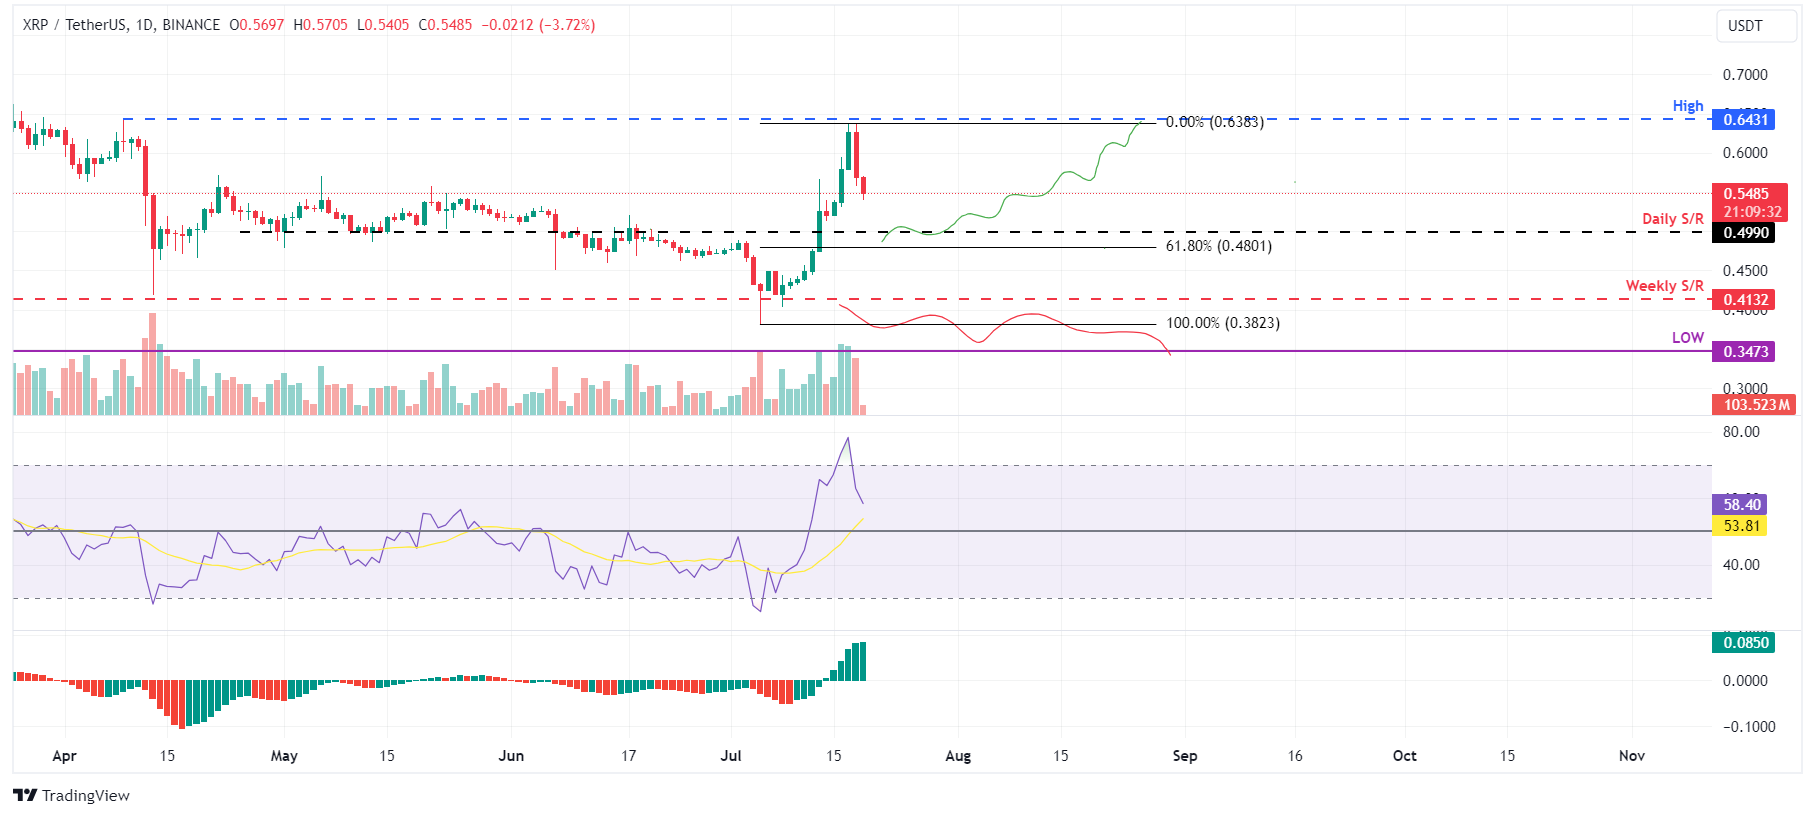
XRP/USDT daily chart
However, if Ripple's daily candlestick closes below $0.413, it indicates sustained bearish sentiment, forming a lower low in the daily timeframe. Such a scenario could lead to a 16% decline in Ripple's price, targeting a revisit of its low from March 12 at $0.347.
Author

Manish Chhetri
FXStreet
Manish Chhetri is a crypto specialist with over four years of experience in the cryptocurrency industry.


