MATIC price takes center-stage, readies Polygon for an impressive 85% rally
- MATIC price regains bullish groove with a 29% gain, besting most cryptocurrencies.
- Polygon volume profile finally reveals accumulation yesterday, with daily volume coming in at 3x the daily average.
- 200-day simple moving average (SMA) serves as a springboard as prominent investors accumulate digital assets.

MATIC price closed yesterday with the best gain since the 63% gain recorded on May 24, marking a trend reversal for the Indian blockchain. Moving forward, Polygon confronts three tactical resistance levels that may impede a quick follow-through on the dynamic rebound. In fact, buying on weakness may provide the best approach to participating in a new advance.
MATIC price consolidates the bullish turn making patience imperative
MATIC price exploded onto the scene again with a headlining gain of 29%, pushing near the top of the cryptocurrency complex list of top performers. It was a loud rebuttal to the -40% decline that had dominated price action since the breakdown from the symmetrical triangle pattern on July 12. Nevertheless, Polygon is only up 10% for the week and is still down -25% in July, emphasizing the recent challenges for market speculators.
The MATIC price event was notable but what induces a renewed conviction in the Polygon story is the commitment and emotion displayed by investors, as it was the first positive day on above-average volume since the May 26 gain of 14%. The robustness of the bid reveals the engagement of prominent and institutional investors at the strategically important 200-day SMA at $0.66.
Yesterday’s rebound struck resistance at the June 22 low of $0.92, as well as today. It is one of three technical challenges that await eager Polygon market operators. The second resistance point is the symmetrical triangle’s apex at $1.06, followed by the 50-day SMA at $1.18. A rally above the moving average puts MATIC price on a path to the June 15 high of $1.75 and an 85% gain from the current price.
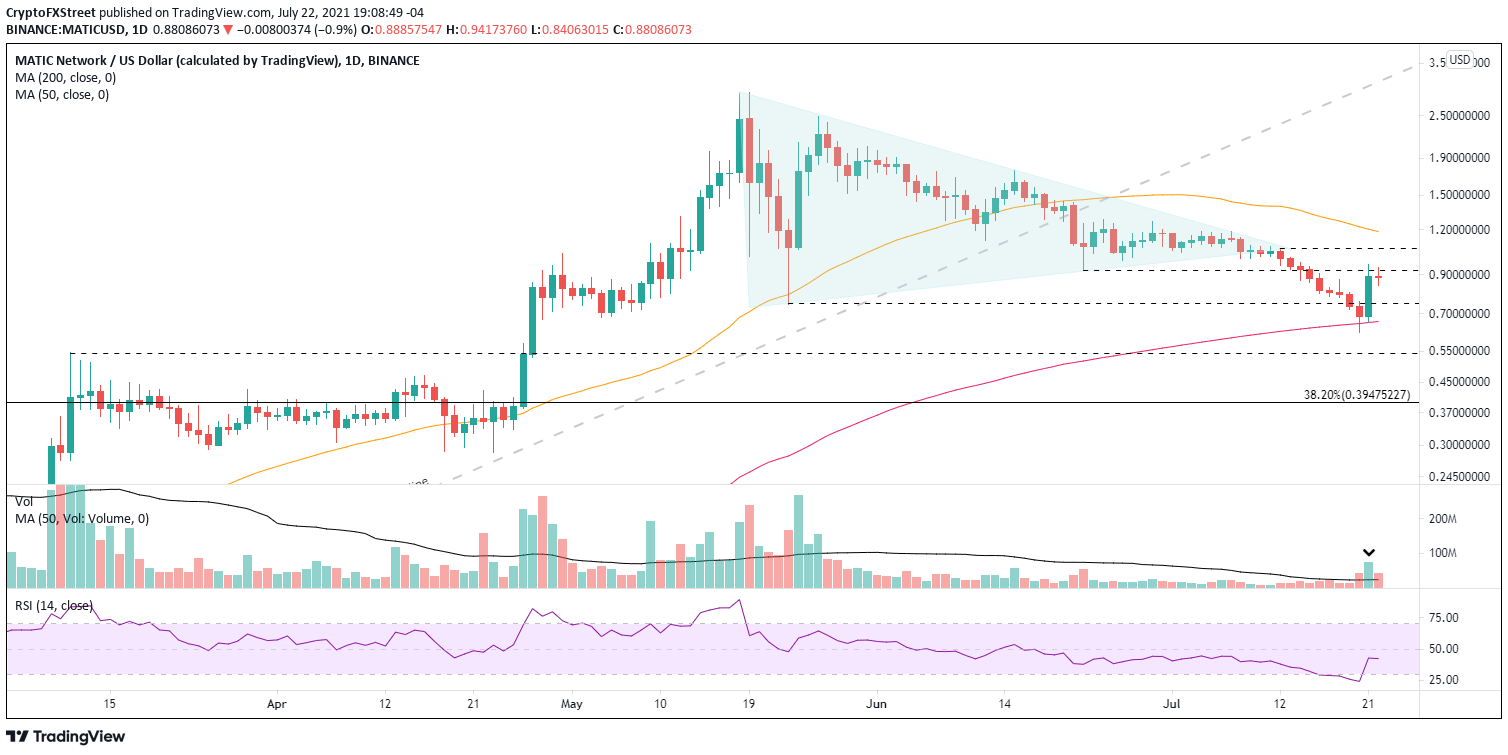
MATIC/USD daily chart
If there is an eagerness to be involved with Polygon, it is recommended to use a trade above yesterday’s high of $0.95 to trigger accumulation. The recommendation is based on the constructive MATIC price action since the rebound high, showing no selling on the intra-day charts as it constructs a pennant pattern.
A more profitable alternative is to allow MATIC price to correct some of the rebound and use the weakness to build a position. Levels of interest include the 50 four-hour SMA at $0.82 and the May 23 low at $0.74.
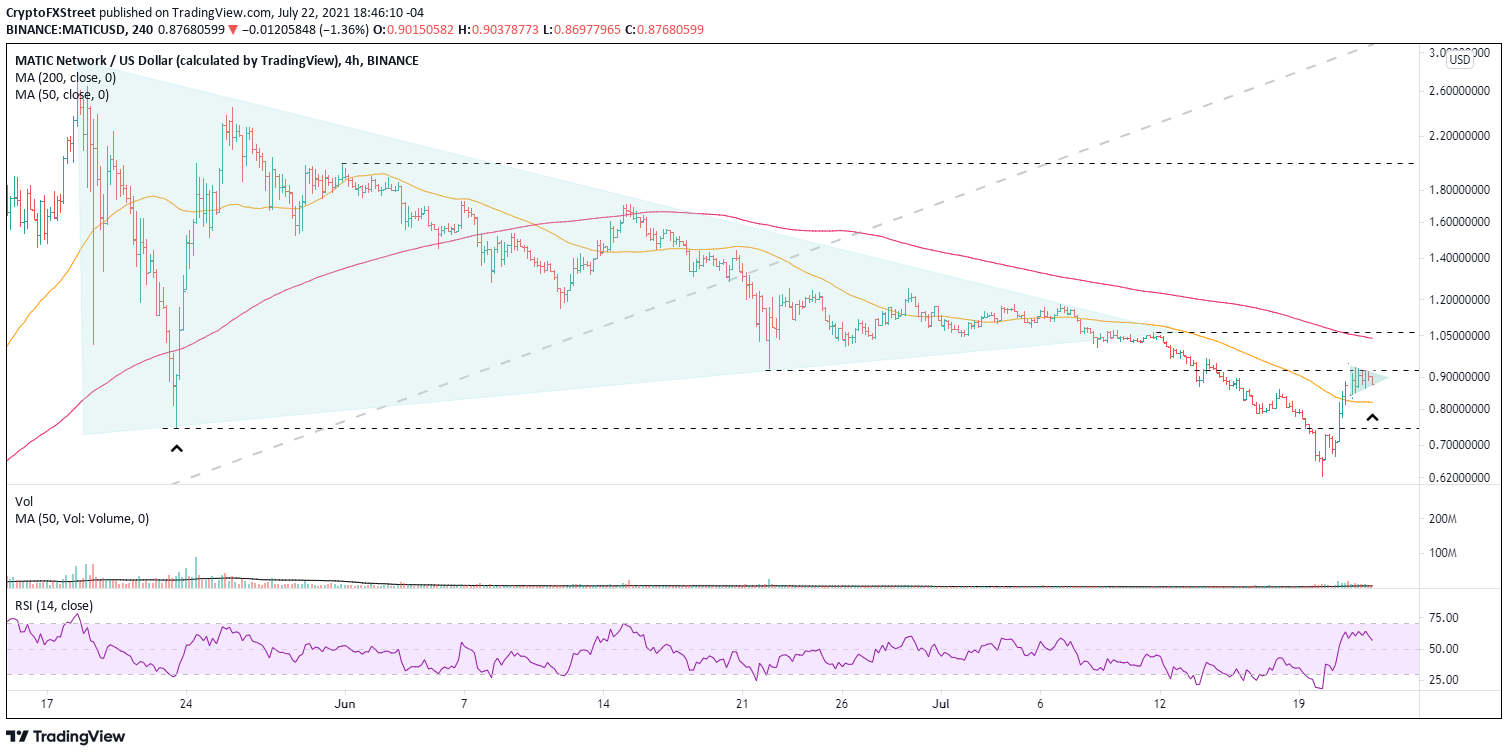
MATIC/USD 4-hour chart
If a MATIC price pullback accelerates into sell-off, the 200-day SMA is the critical support level on a daily closing basis. A close below the moving average raises the probabilities of the correction continuing, putting Polygon at risk of testing the March 11 high of $0.54 or, potentially, the 38.2% Fibonacci retracement of the 2021 advance at $0.39.
The constructive price action on the intra-day charts supplemented by the commitment and emotion behind the 29% gain tilts the outlook bullish. To participate, buying on weakness is the preferred option, but bullish opportunities usually emerge when momentum transforms into a pennant formation, as with MATIC price. Either way, there is impressive upside potential for Polygon investors.
Here, FXStreet's analysts evaluate where Polygon could be heading next.
Author

Sheldon McIntyre, CMT
Independent Analyst
Sheldon has 24 years of investment experience holding various positions in companies based in the United States and Chile. His core competencies include BRIC and G-10 equity markets, swing and position trading and technical analysis.


