MATIC Price Prediction: Polygon hangs by a thread
- Polygon has been on a downward slope for two weeks.
- Buyers are trying to support price action, but sellers are in control.
- A break of two technical barriers opens up more downside.

Polygon (MATIC) is on the verge of breaking lower as buyers try to support price action at $1.32. Buyers have two good reasons to get in here. The volume, however, shows buyers are not convinced that this is the right time.
The break of the orange ascending trend line raises red flags for MATIC and probably makes buyers hesitant to step in. Proof of this is to be found in the descending volume since August 11. Buyers seized control of the price action and ran up prices toward $1.70. Since then, volume is running thin, and sellers could squeeze buyers out of their profit back to their point of entry.
It is questionable if MATIC still has room to the upside with such low volume
A bounce off the monthly R1 resistance level at $1.30 is what supports Polygon price for the moment. A new break below would open up space to dip 10% with no fundamental supporting factors on the way down. From a buy-side perspective, the risk-reward is not attractive at all. The logical place to place a stop as a buyer is at $1.20, making a stop of 10% risky.
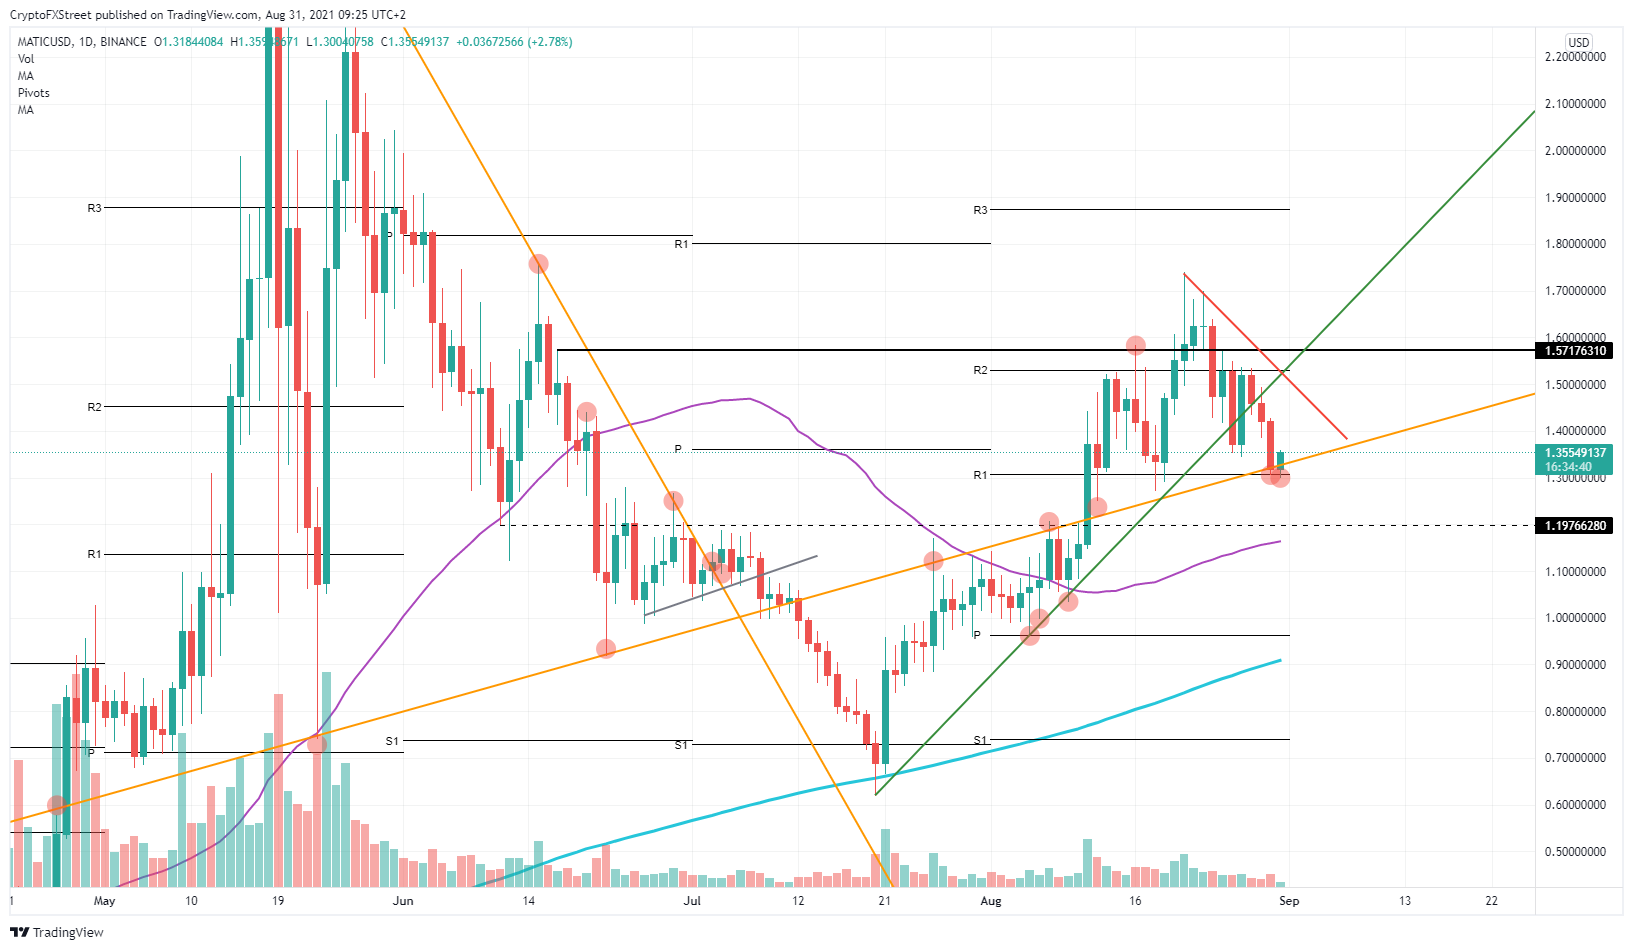
MATIC/USD daily chart
On the upside, the reward in that same trade is not tempting either. With the red descending trend line, the profit is limited to the upside. This explains why volume is so thin, as not many buyers will risk taking this trade-in.
Sellers will want to push MATIC below $1.30 and have their profit targets lined up for $1.20-$1.17. This level makes more sense for buyers as well to step in. Sellers will want to buy here to lock in their profits, and not only is there the historical level around $1.20. That level acted on August 7 as resistance and turned into support on August 12. Just below there is the 55-day Simple Moving Average (SMA) that will serve as second support and a good place for buyers to place their stops just below. The risk-reward ratio is also more attractive, with a possible retest of $1.30 or 8% gains against 3% risk.
Author

Filip Lagaart
FXStreet
Filip Lagaart is a former sales/trader with over 15 years of financial markets expertise under its belt.


