MATIC Price Prediction: Polygon correction near completion, primed for a rebound
- MATIC price steadying above the trough of a rising wedge pattern.
- 4-hour Relative Strength Index (RSI) near oversold reading.
- Volume profile does not reveal an eager desire to liquidate or cut holdings.

MATIC price decline since the April 29 high at $0.946 has taken a corrective form, and it is near completion, touching the trough of the rising wedge pattern at $0.675.
MATIC price potential yet to be realized
From March 14 to April 25, Polygon moved sideways in a wide range of 60%, with the weekly closes occurring between $0.360 and $0.385 for seven of the eight weeks. It was a rare formation, but the MATIC price contraction driven by speculator indecision on both sides formed the energy to carry the altcoin over 200% higher in eight days.
The drop below the wedge’s lower trend line on April 30 kickstarted the decline, taking MATIC price down 20% at today’s low, and right in line with the forecast first penned in an April 30 FXStreet article. Some residual selling pressure can be expected, and Polygon may briefly undercut the trough at $0.675 before the resumption of the advance.
MATIC price will encounter minor resistance at the 50 four-hour moving average at $0.772. Pertinent resistance will emerge at the 61.8% and 78.6% Fibonacci retracement levels at $0.838 and $0.884, respectively. Speculators can anticipate further resistance at the psychologically important $1.00.
If volume explodes as the end of April, MATIC price will conquer the all-time high at $0.946, giving it close to a $5 billion market capitalization. The potential exists for the rally to touch the 161.8% extension of the current correction at $1.153.
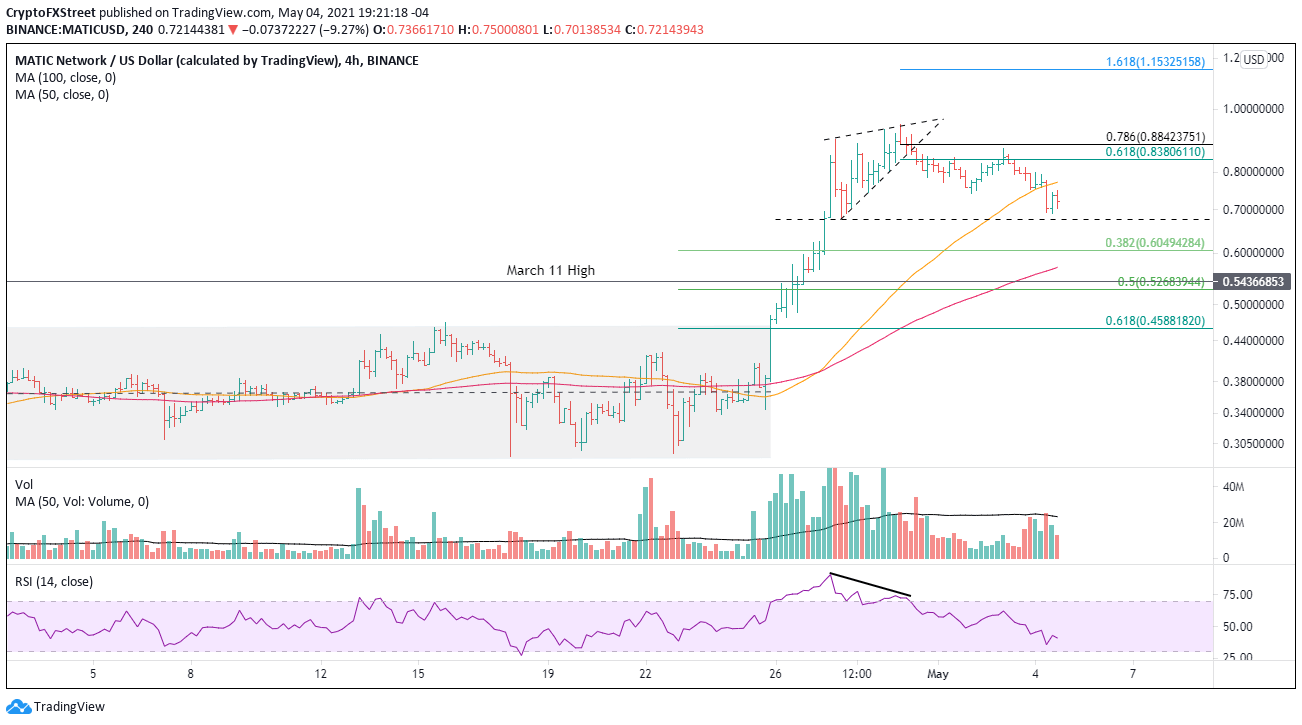
MATIC/USD 4-hour chart
A close below $0.675 on the 4-hour chart will shift the outlook to neutral and expose MATIC price to a test of $0.605, or even the March 11 high at $0.540. The wedge’s measured move target is $0.517.
Author

Sheldon McIntyre, CMT
Independent Analyst
Sheldon has 24 years of investment experience holding various positions in companies based in the United States and Chile. His core competencies include BRIC and G-10 equity markets, swing and position trading and technical analysis.



