MATIC Price Prediction: Polygon bulls kickstart 34% upswing
- MATIC price could be preparing for a major rally if buying pressure increases.
- An uptick in bullish sentiment could see Polygon reach the upper boundary of the governing technical pattern at $2.32.
- A key technical indicator suggests that MATIC has recently formed a local bottom.

MATIC price has recently formed a local bottom according to a key technical indicator, suggesting that Polygon is ready for a bullish reversal. The token could tag the upper boundary of the governing technical pattern at $2.32 next if it slices above crucial resistance levels.
MATIC price forms local bottom
MATIC price has formed an ascending parallel channel on the 12-hour chart, projecting a bullish outlook. Polygon could target the upper boundary of the prevailing chart pattern at $2.32 next, coinciding with the 127.2% Fibonacci extension level.
Polygon has tagged the lower boundary of the governing technical pattern at $1.59 as support on February 14. At the same time, while MATIC price reached the swing low, the Momentum Reversal Indicator (MRI) has flashed a bottom signal, suggesting the token is preparing for a reversal.
MATIC price will face immediate resistance at the 21 twelve-hour Simple Moving Average (SMA) at $1.79, intersecting with the 61.8% Fibonacci retracement level. Additional hurdles may emerge at the middle boundary of the governing technical pattern at $1.93, coinciding with the 78.6% Fibonacci retracement level.
Polygon will face additional headwinds at $2.00, where the 100 twelve-hour SMA and the 200 twelve-hour SMA intersect, then at the resistance line given by the MRI at $2.10. Only if MATIC price manages to overcome the aforementioned challenges would see the token reach the optimistic target at $2.32.
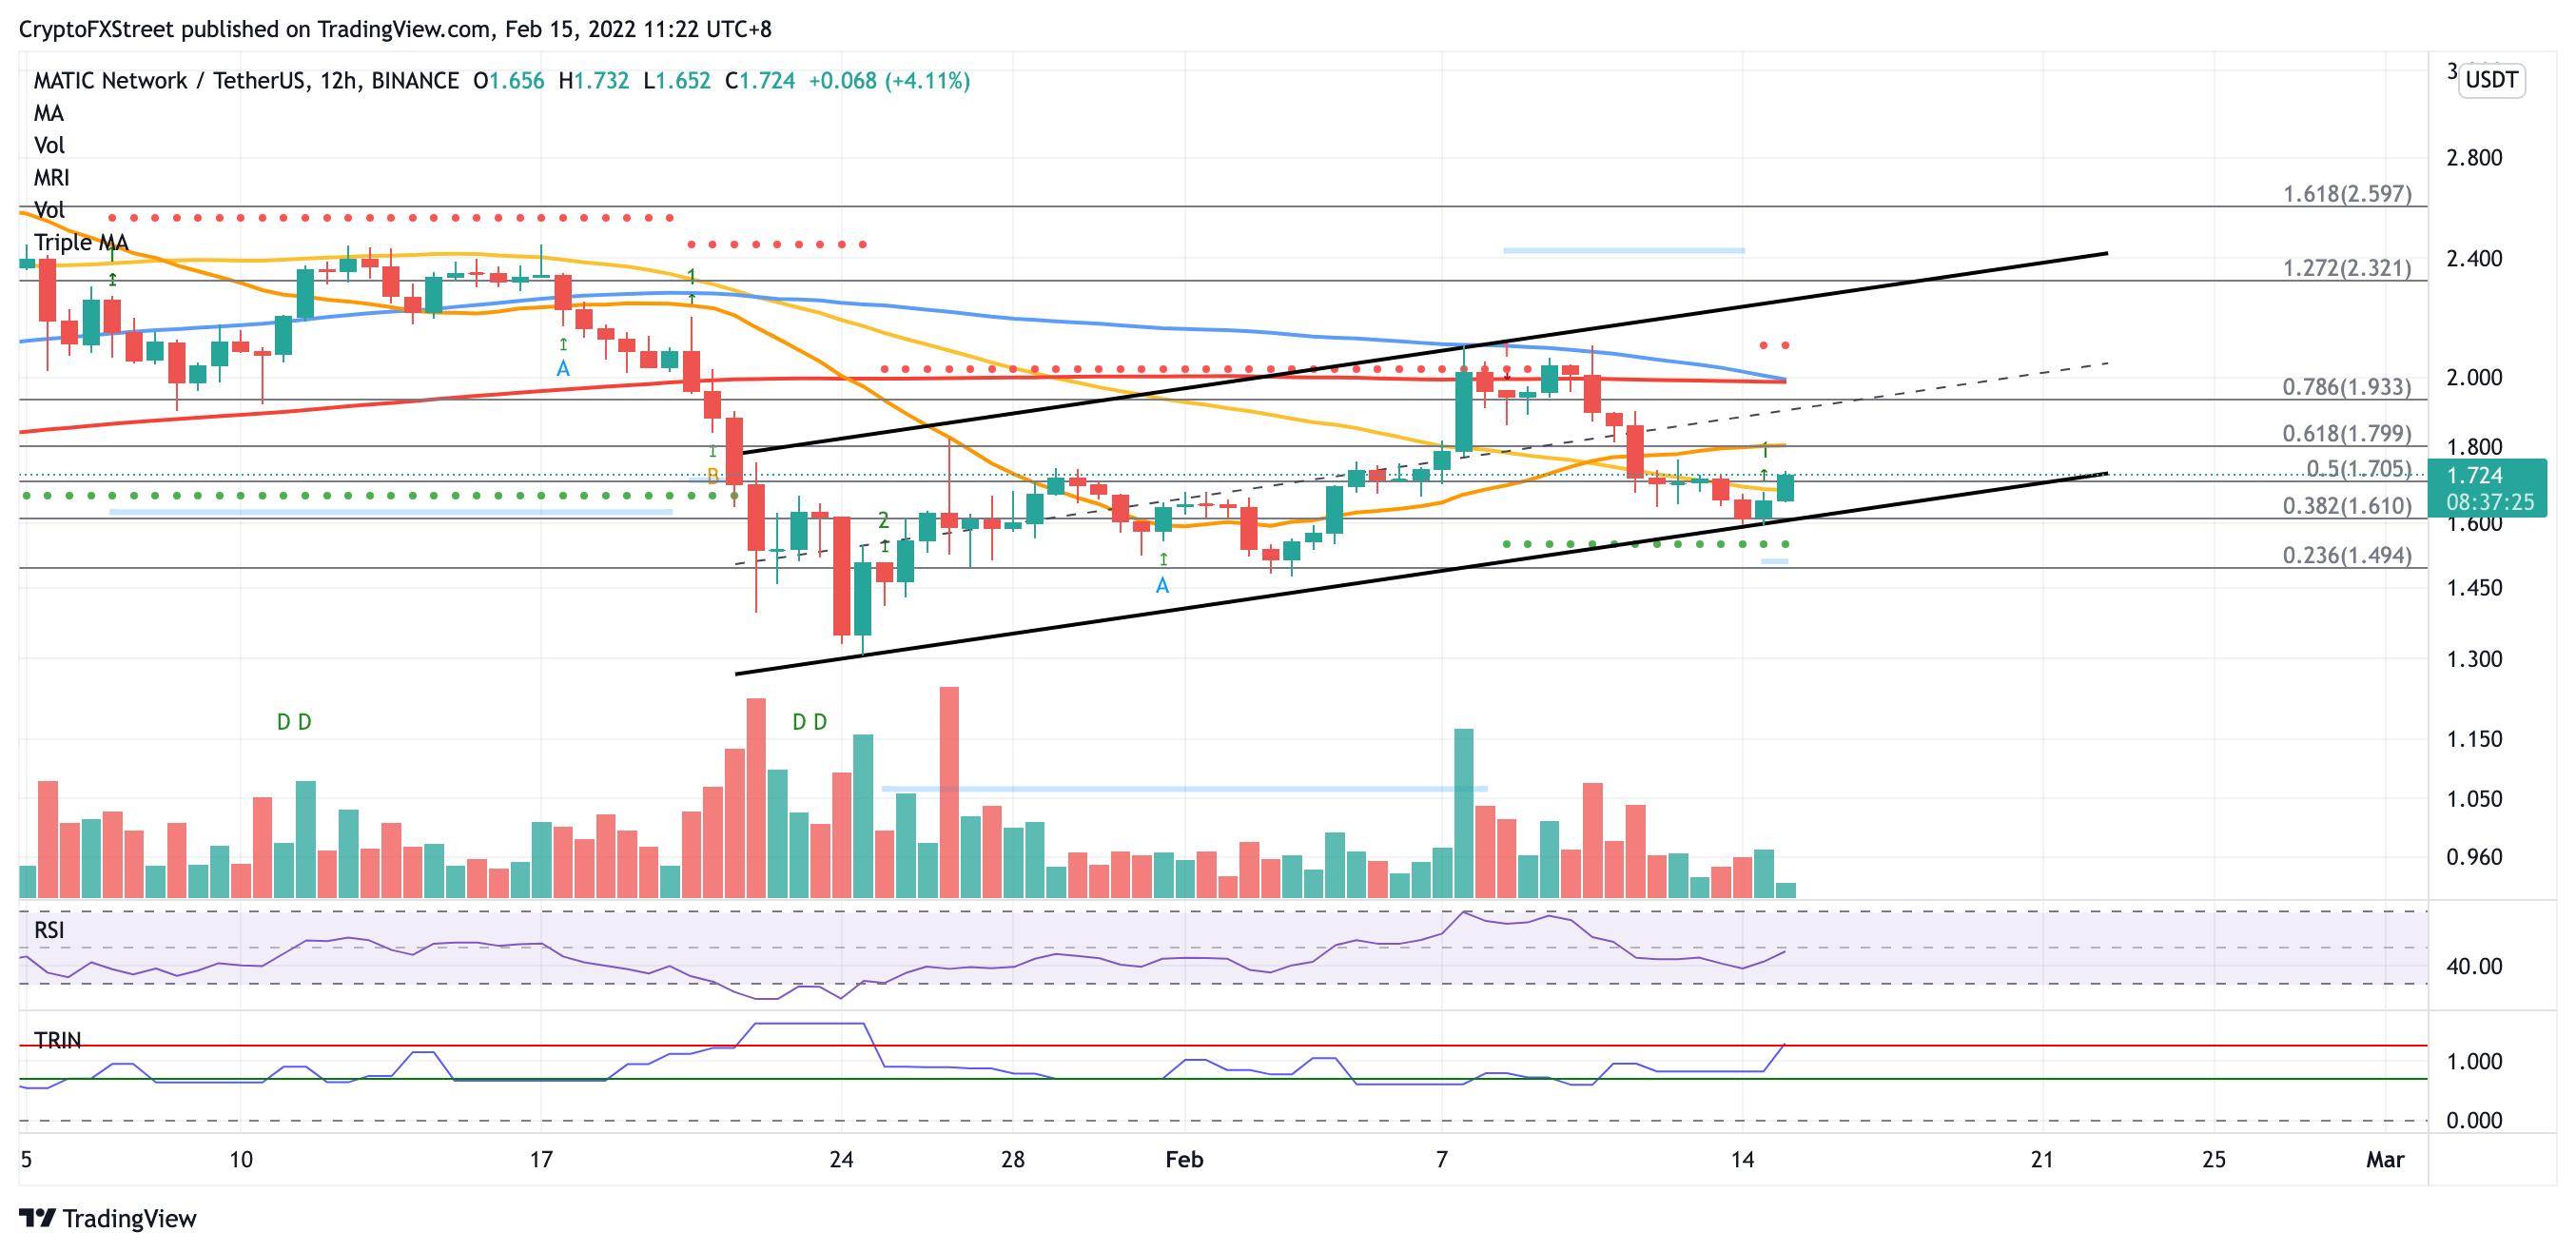
MATIC/USDT 12-hour chart
However, if selling pressure increases, MATIC price could fall toward the first line of defense at the 50% retracement level at $1.70, then at the 50 twelve-hour SMA at $1.65.
Additional reliable support will emerge at the lower boundary of the governing technical pattern at $1.61, where the 38.2% Fibonacci retracement level is also located.
Author

Sarah Tran
Independent Analyst
Sarah has closely followed the growth of blockchain technology and its adoption since 2016.


