MATIC Price Prediction: Polygon bulls await big leap toward new all-time high
- MATIC price is preparing for a significant climb toward a new all-time high.
- The prevailing chart pattern suggests a 21% move to the upside.
- Slicing above $2.43 would validate the governing technical pattern and put the optimistic target on the radar.

MATIC price is on the verge of a major upswing toward a new record high as a bullish chart pattern has emerged. The governing technical pattern projects a 21% ascent toward $2.95 if Polygon slices above $2.43.
MATIC price eyes $2.95 next
MATIC price has formed a cup-and-handle pattern on the 4-hour chart, forecasting a 21% surge toward a new all-time high at $2.95. The bullish target would only be validated if Polygon breaks above the neckline of the prevailing chart pattern at $2.43.
The Arms Index (TRIN) is currently suggesting that there are more buyers than sellers in the market, indicating that MATIC price may be preparing for an upswing.
The first line of resistance that will appear after MATIC price slices above the neckline will be at the 78.6% Fibonacci retracement level at $2.51. Polygon will face another challenge at the January 3 high at $2.59.
An additional obstacle will emerge at the December 24 high at $2.73. MATIC price may confront another hurdle at the 127.2% Fibonacci extension level at $2.88, where the resistance line given by the Momentum Reversal Indicator (MRI) also sits.
Polygon may also face an additional headwind at the record high at $2.92 before attempting to reach a new peak.
However, if selling pressure increases, MATIC price may discover immediate support at the 61.8% Fibonacci retracement level at $2.38, then at the 200 four-hour Simple Moving Average (SMA) at $2.35.
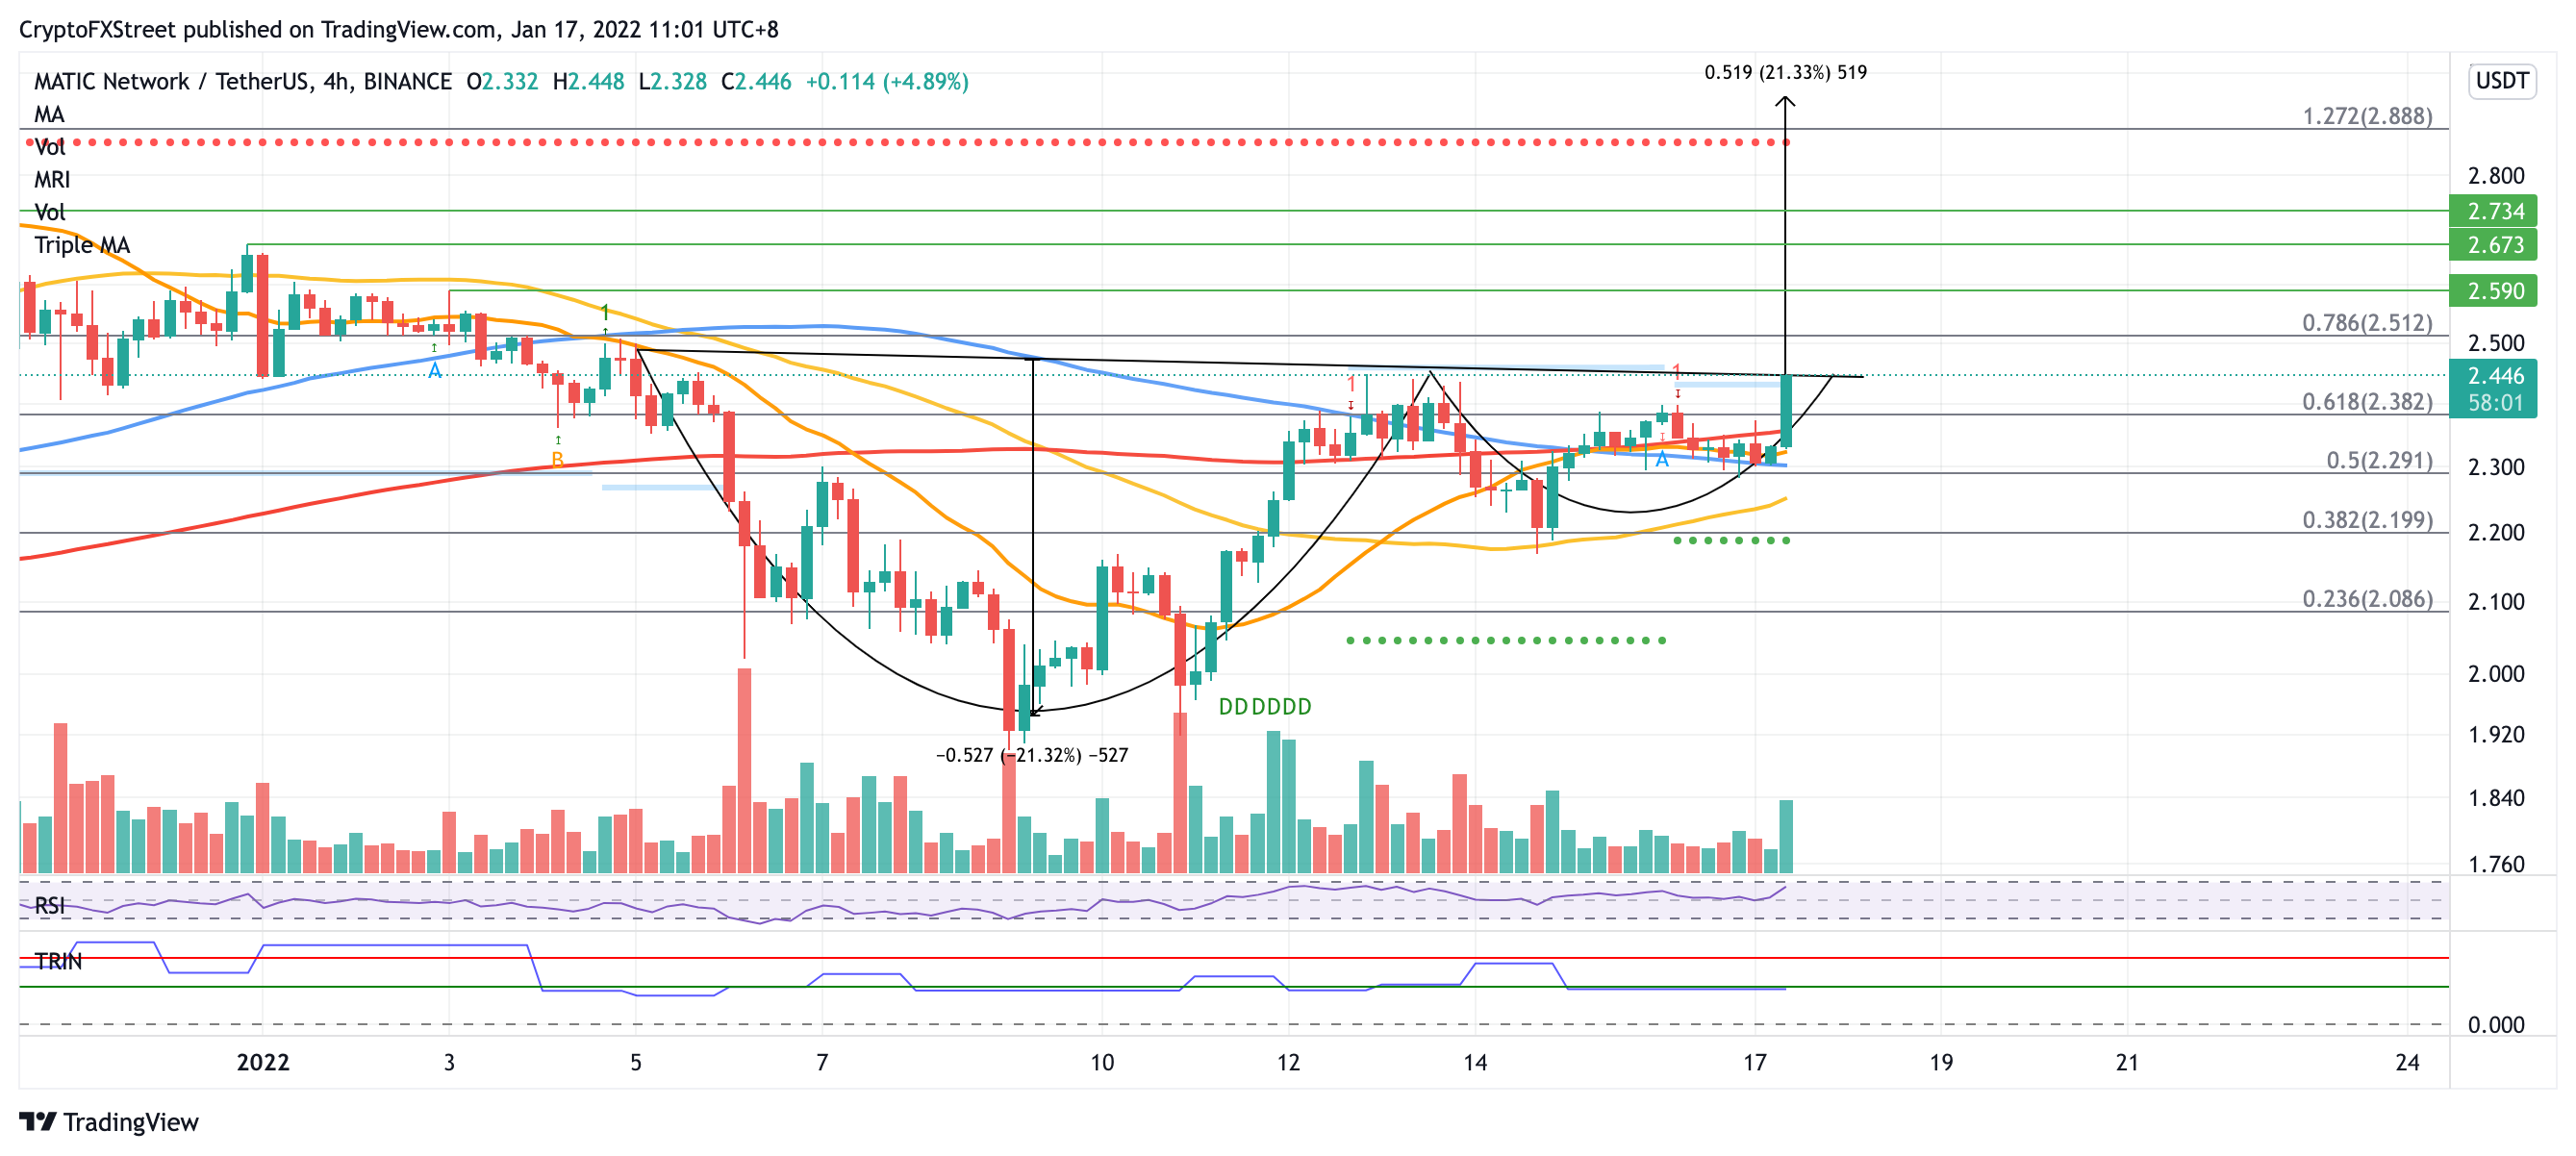
MATIC/USDT 4-hour chart
Additional lines of defense may emerge at the 21 four-hour SMA and at the 100 four-hour SMA, which sit near the 50% retracement level at $2.29.
If Polygon slides lower, a foothold may appear at the 50 four-hour SMA at $2.24, then at the 38.2% Fibonacci retracement level at $2.19, coinciding with the MRI’s support line.
However, investors should note that if MATIC price falls below the aforementioned last line of defense, the bullish forecast may be invalidated.
Author

Sarah Tran
Independent Analyst
Sarah has closely followed the growth of blockchain technology and its adoption since 2016.