MATIC could rally to $2.50 if it breaks out above this resistance level
- MATIC price tests the breakout below the lower trendline of a rising wedge.
- Failure to return inside the rising wedge would likely confirm the breakout and trigger a sell-off.
- A successful move above resistance would generate a powerful bear trap.

MATIC price action dropped below the lower trendline of a rising wedge last Friday. That move was the first close below that pattern since it was discovered in September 2021. As a result, trading opportunities for both sides of the market are now present.
MATIC price must return and close above the $2.20 value area to deny bears a bearish breakout
MATIC price is sitting in a tough spot. Saturday's close has contributed to more bearish activity and pushed MATIC to the first close below the daily Cloud since November 27, 2021. However, bulls staved off any further selling pressure with some intense buying pressure on Sunday to close MATIC higher by nearly 7% and to a close above the Cloud – but just below the lower trend line of the rising wedge.
There is a theoretical long setup on the $0.01/3-box reversal Point and Figure chart for MATIC price. The long setup is a buy stop order at $2.16, a stop loss at $2.12, and a profit target at $2.30. The entry is based on the breakout above a triple-top and the neckline of an inverse head and shoulders pattern. The trade idea represents a 3.5:1 reward for the risk setup. The projected profit targets would put MATIC comfortably back inside the rising wedge pattern on the daily candlestick chart.
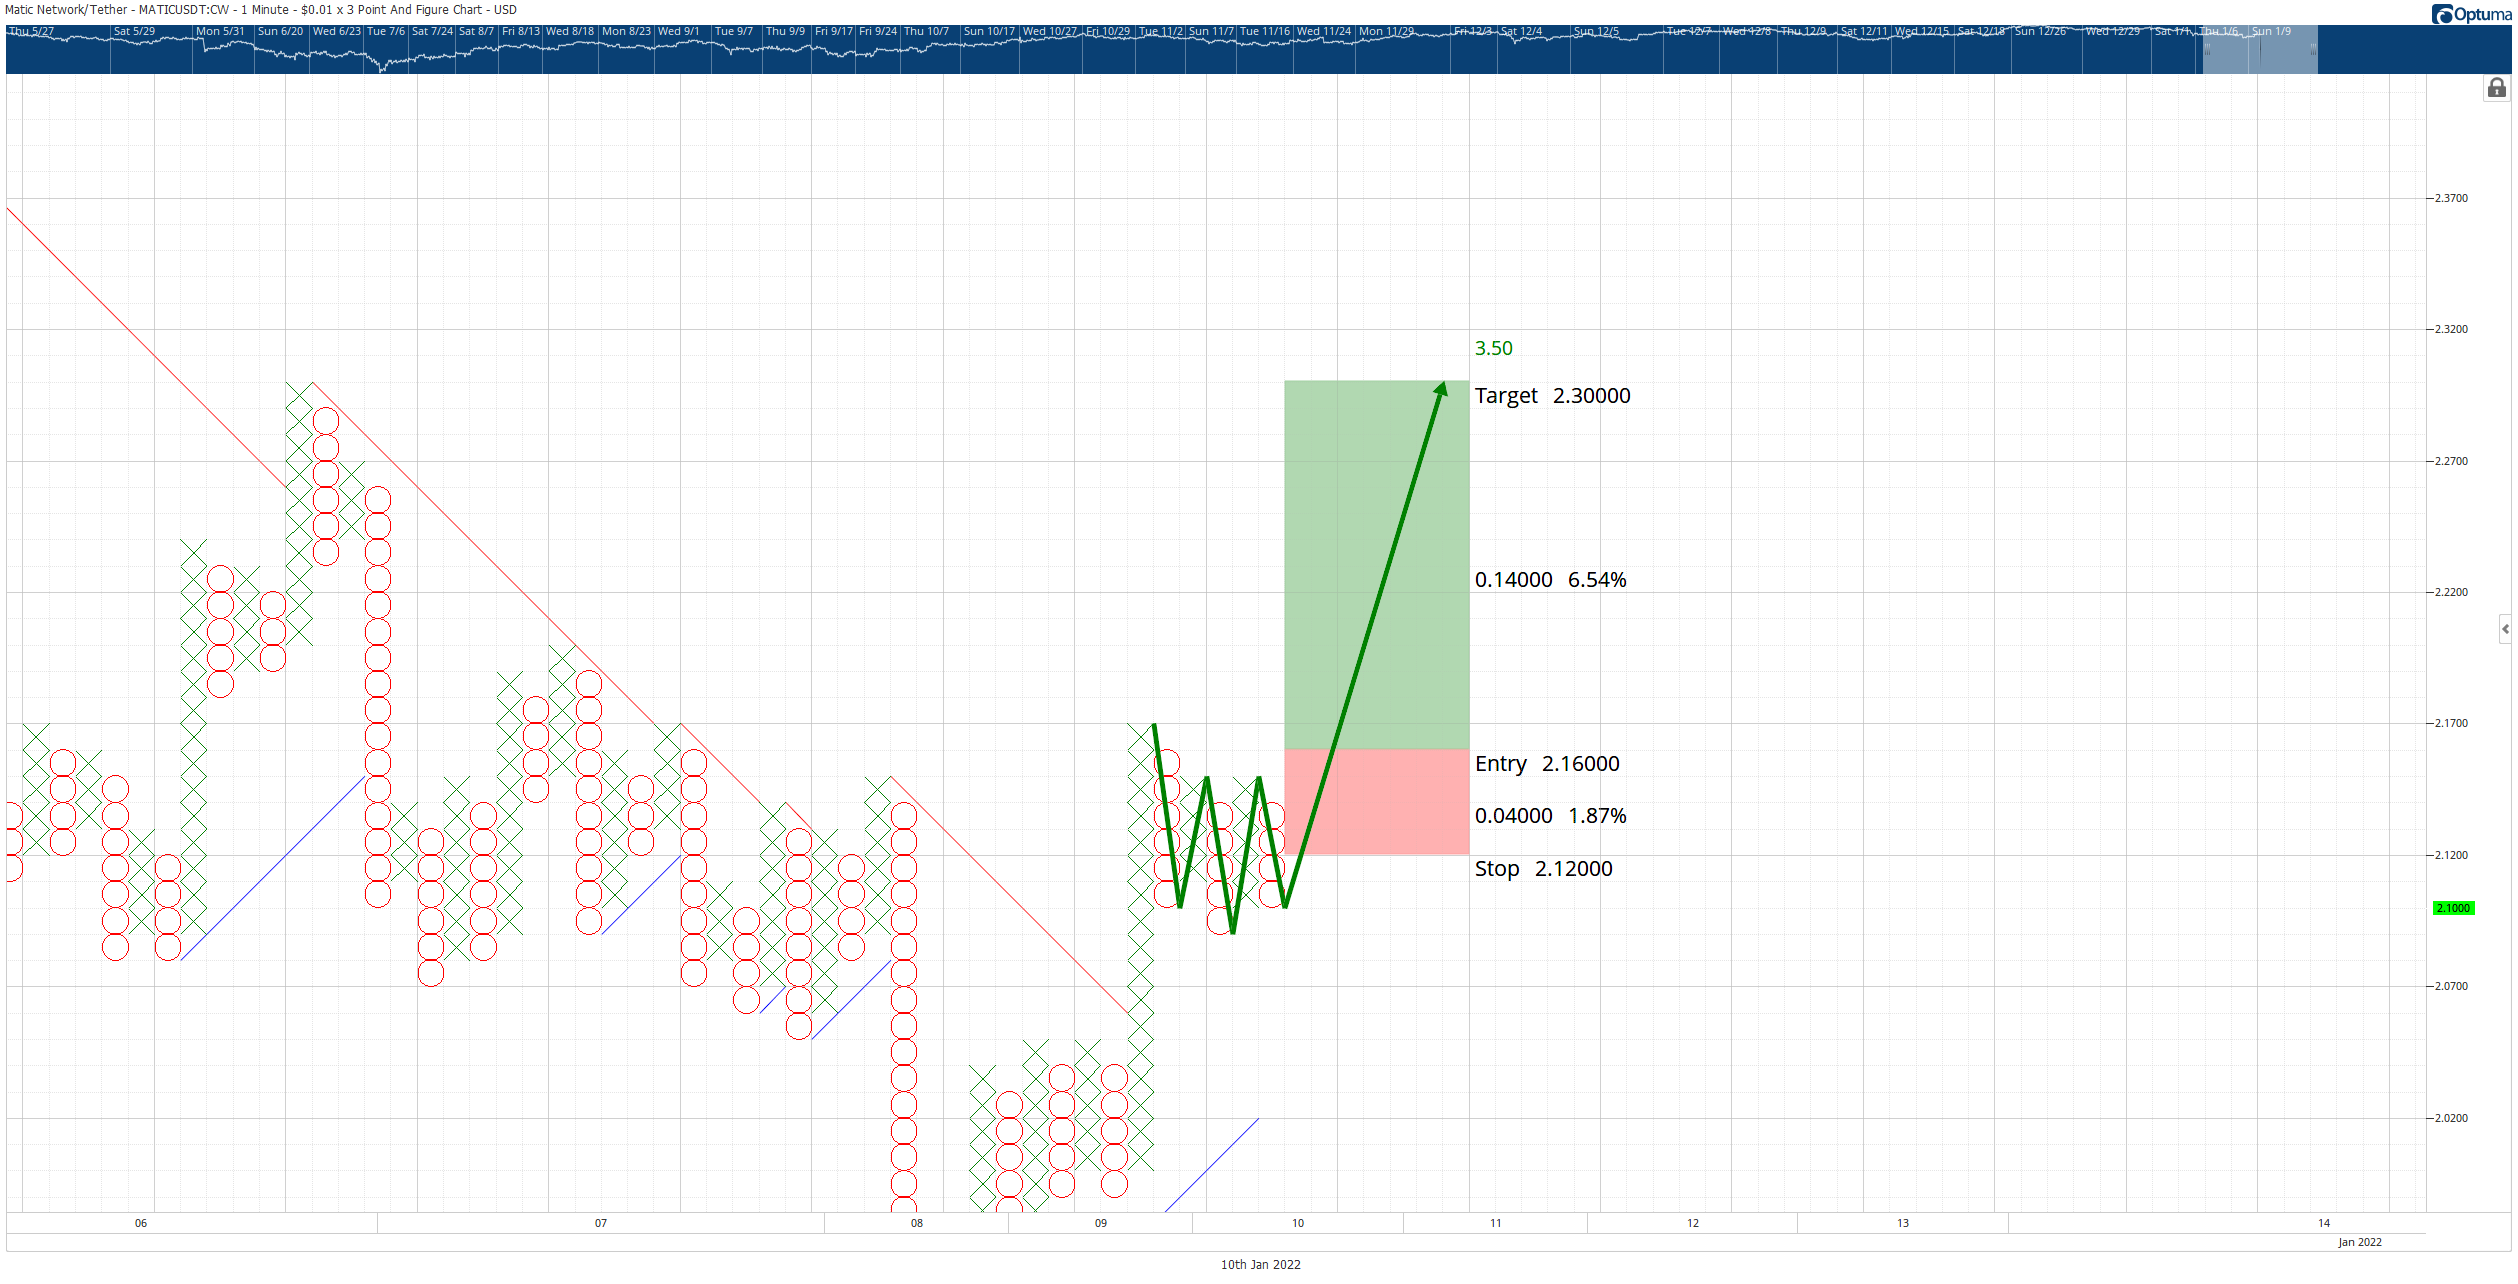
MATIC/USDT $0.01/3-box Reversal Point and Figure Chart
The theoretical long setup is invalidated if the short idea below is triggered first.
If resistance against the lower trend line holds and MATIC price begins to drop, there is a fantastic short opportunity. The hypothetical short setup is a sell stop order at $1.98, a stop loss at $2.17, and a profit target at $1.40. In addition, the daily close must be at or slightly below the $1.98 entry. If the short setup is triggered, it will fulfill all conditions required for an Ideal Bearish Ichimoku Breakout setup – an entry that portends a significant drop to new three-month lows.
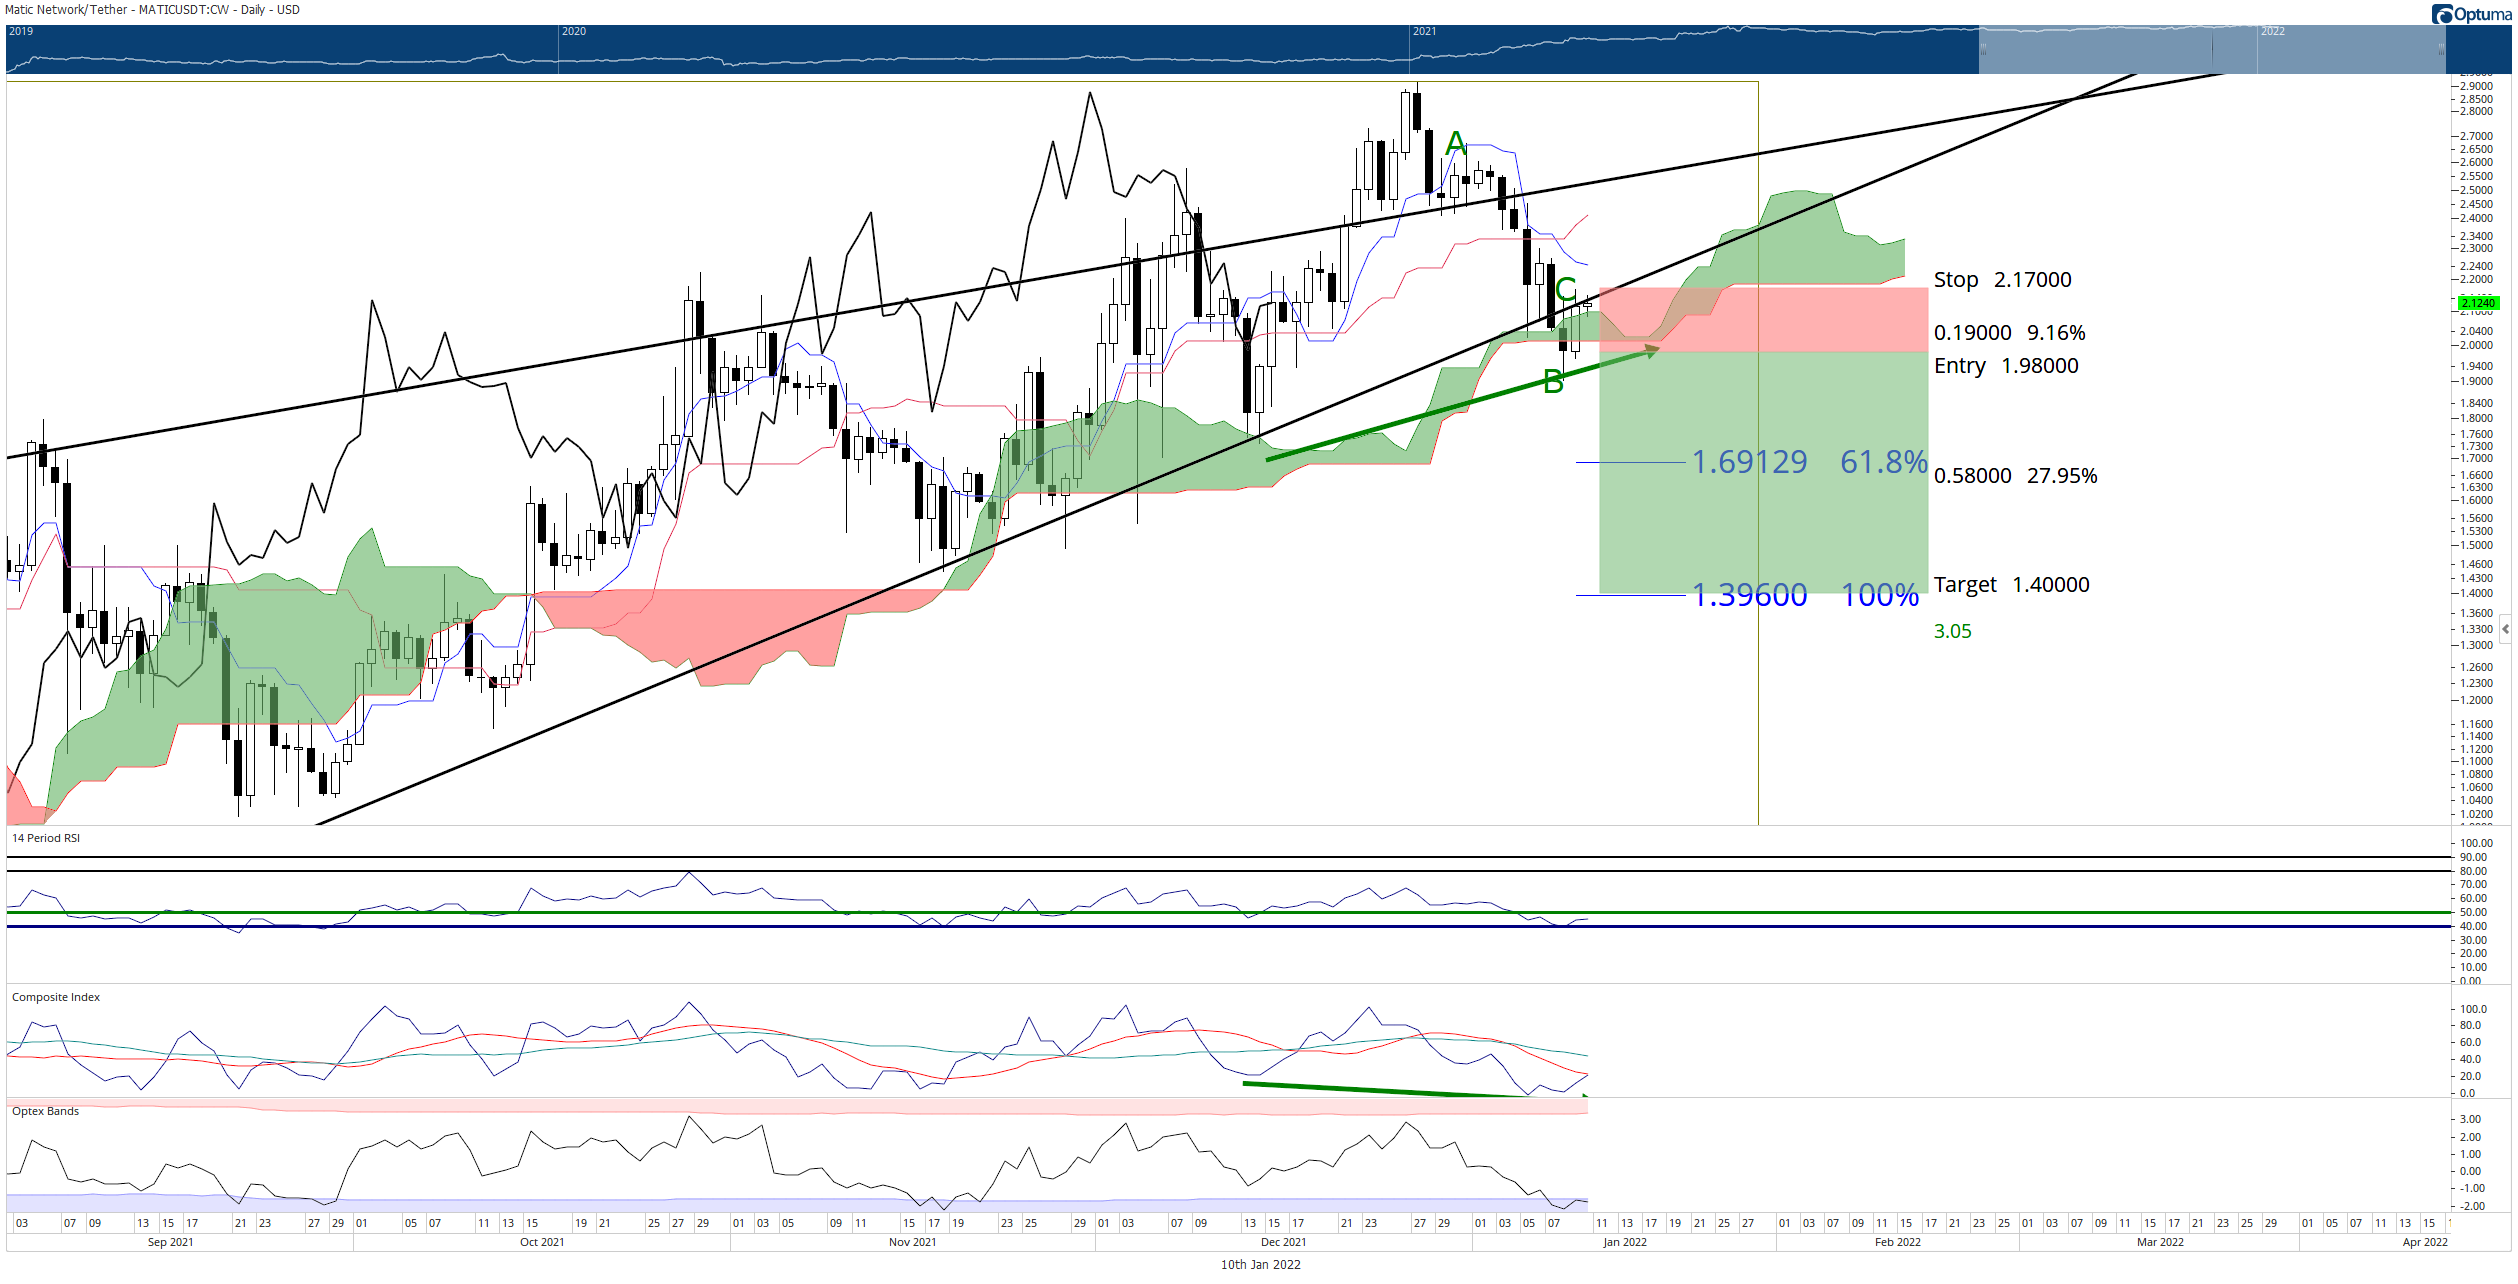
MATIC/USDT Daily Ichimoku Chart
The short setup is invalidated if MATIC price reaches $2.50 before triggered entry.
Author

Jonathan Morgan
Independent Analyst
Jonathan has been working as an Independent future, forex, and cryptocurrency trader and analyst for 8 years. He also has been writing for the past 5 years.


