MATIC price poised for rally as on-chain data shows a positive bias
- Artemis data shows that Polygon's TVL is rising, suggesting growing activity and interest within the MATIC ecosystem.
- On-chain data shows that MATIC's open interest is rising, and the long-to-short ratio is above one, suggesting a bullish move.
- Investors should be cautious about negative spikes in the Network Realized Profit/Loss metric.

Polygon's (MATIC) price has risen 27% since the start of this week and, as of Thursday, is continuing to trade higher by 0.5% at $0.52. On-chain data shows that MATIC's Total Value Locked (TVL) is rising, Open Interest (OI) is rising, and the long-to-short ratio is above one, suggesting a continuation of Polygon's bullish move in the upcoming days.
Polygon price gains traction as on-chain data suggests a positive trend
Crypto intelligence tracker Artemis data shows that MATIC's TVL increased from $853.53 million on Monday to $916.70 million on Thursday, constantly rising since August 5.
This 7.5% increase in TVL indicates growing activity and interest within the Polygon ecosystem. It suggests that more users deposit or utilize assets within MATIC-based protocols, adding credence to the bullish outlook.
-638599033616806490.jpg)
Polygon TVL chart
Data from CoinGlass shows that the futures' OI in Polygon at exchanges is also increasing. The OI indicates the total number of outstanding derivative contracts that have not been settled (offset by delivery) and whether money flows into the contract are increasing or decreasing.
Increasing OI represents new or additional money entering the market and new buying, which suggests a bullish trend. When OI decreases, it is usually a sign that the market is liquidating, more investors are leaving, and the current price trend is ending.
The graph below shows that MATIC's OI increased from $114.74 million on Monday to $209.39 million on Thursday, the highest OI since mid-June. This indicates that new or additional money is entering the market and new buying is occurring.
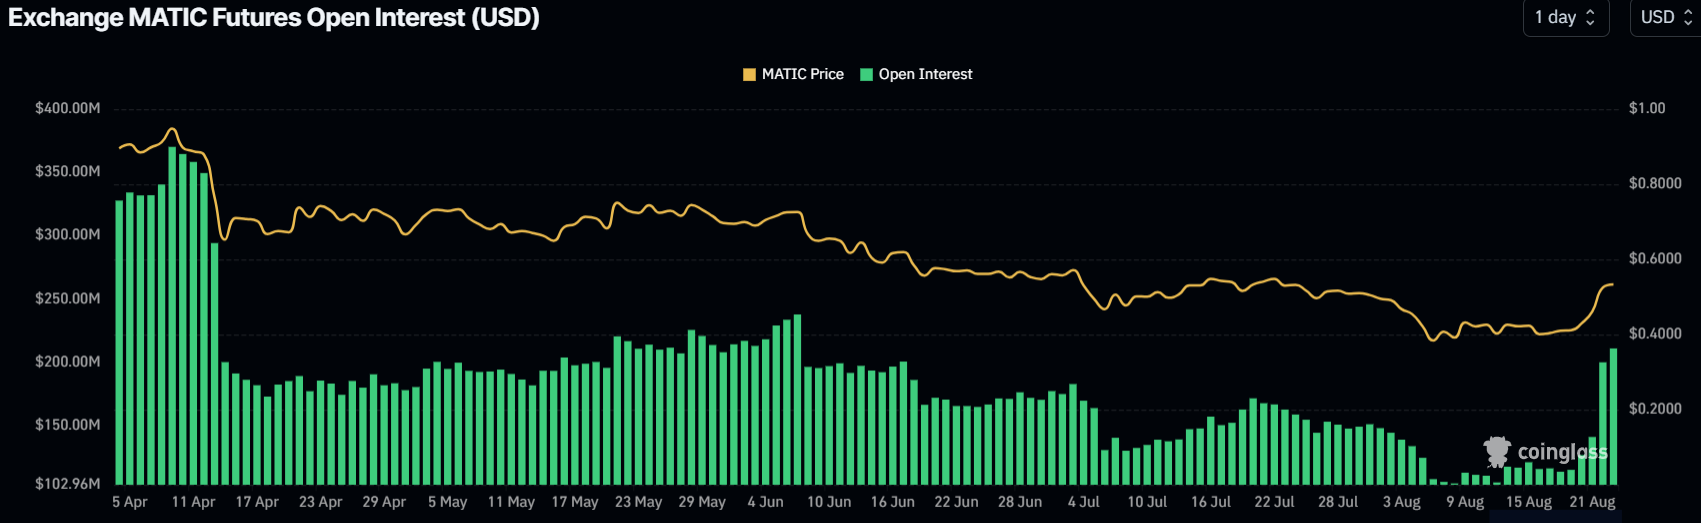
MATIC Open Interest chart
According to Coinglass's data, MATIC's Binance long-to-short ratio is 1.56. This ratio reflects bullish sentiment in the market, as the number above one suggests that more trades anticipate the price of the asset rising, bolstering Polygon's bullish outlook.
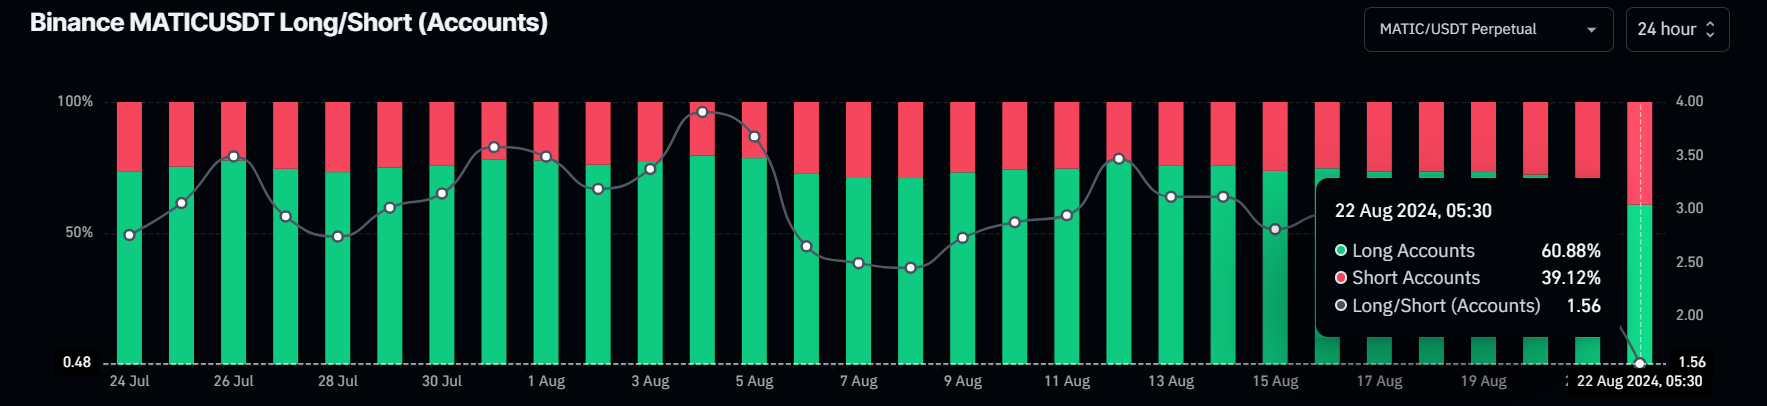
MATIC long-to-short ratio chart
Despite new buying, greater blockchain usage, and increasing bullish sentiment, MATIC's Network Realized Profit/Loss metric shows a negative spike. This indicates that its holders are, on average, realizing losses, which could increase supply on exchanges. Consequently, investors should not anticipate an immediate price rally for the token.
%20[10.36.43,%2022%20Aug,%202024]-638599034858890326.png)
MATIC's Network Realized Profit/Loss chart
Cryptocurrency metrics FAQs
The developer or creator of each cryptocurrency decides on the total number of tokens that can be minted or issued. Only a certain number of these assets can be minted by mining, staking or other mechanisms. This is defined by the algorithm of the underlying blockchain technology. Since its inception, a total of 19,445,656 BTCs have been mined, which is the circulating supply of Bitcoin. On the other hand, circulating supply can also be decreased via actions such as burning tokens, or mistakenly sending assets to addresses of other incompatible blockchains.
Market capitalization is the result of multiplying the circulating supply of a certain asset by the asset’s current market value. For Bitcoin, the market capitalization at the beginning of August 2023 is above $570 billion, which is the result of the more than 19 million BTC in circulation multiplied by the Bitcoin price around $29,600.
Trading volume refers to the total number of tokens for a specific asset that has been transacted or exchanged between buyers and sellers within set trading hours, for example, 24 hours. It is used to gauge market sentiment, this metric combines all volumes on centralized exchanges and decentralized exchanges. Increasing trading volume often denotes the demand for a certain asset as more people are buying and selling the cryptocurrency.
Funding rates are a concept designed to encourage traders to take positions and ensure perpetual contract prices match spot markets. It defines a mechanism by exchanges to ensure that future prices and index prices periodic payments regularly converge. When the funding rate is positive, the price of the perpetual contract is higher than the mark price. This means traders who are bullish and have opened long positions pay traders who are in short positions. On the other hand, a negative funding rate means perpetual prices are below the mark price, and hence traders with short positions pay traders who have opened long positions.
Author

Manish Chhetri
FXStreet
Manish Chhetri is a crypto specialist with over four years of experience in the cryptocurrency industry.


