|

MATIC Price Forecast: Polygon pattern offers 35% upside

  • MATIC price lacking conviction as price defines a wide but well-defined range. 
  • The downward pressure of the 50-day simple moving average (SMA) may contain bounce.
  • Polygon, Ethereum’s Internet of Blockchains, enabling fast and free transactions.

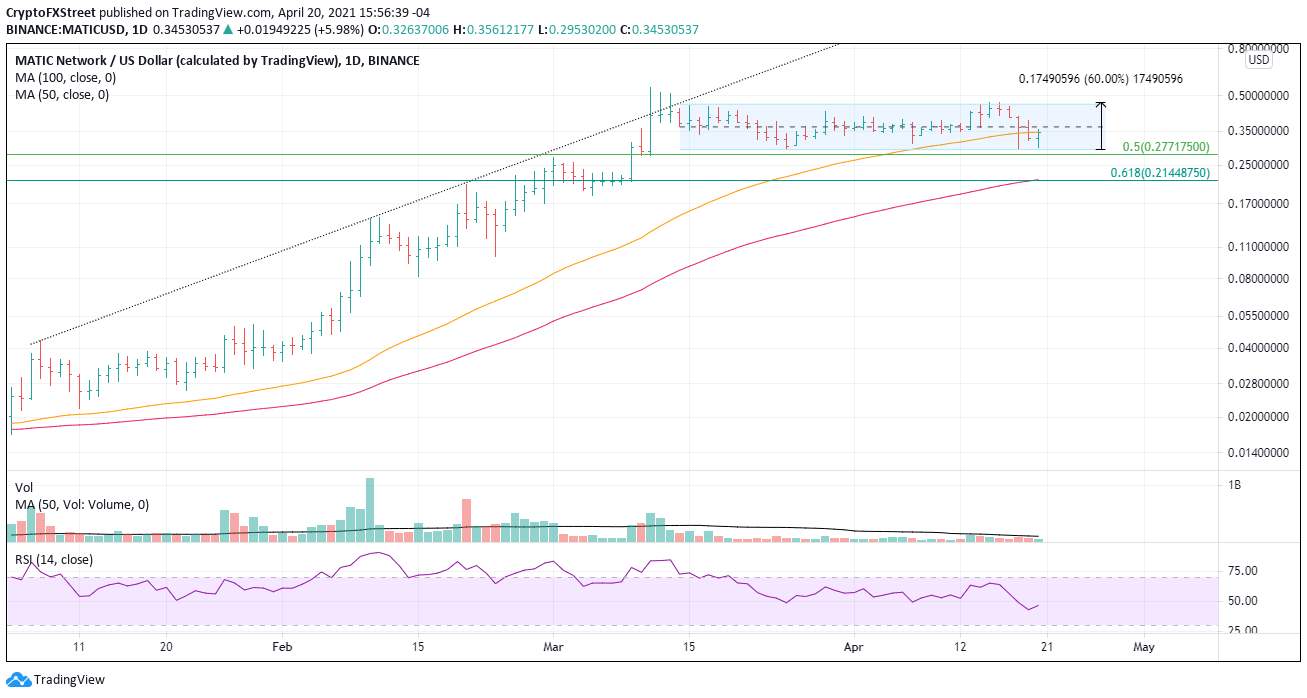
MATIC price has traded in a 60% range since mid-March. The notable indecision hints that speculators are not as enthusiastic about the Polygon story as in the first part of 2021, recommending a range-based strategy until resistance or support is broken. 

MATIC price waiting on a breakthrough during tense crypto environment

Polygon trades just below the 50-day simple moving average (SMA) at $0.347 and the mid-line of the range at $0.367. To increase the probability of success, speculators should look for a pullback near the lows of the range at $0.291 and use the mid-line at $0.366 as the first profit target, followed by the range highs at $0.459. If speculators are impatient, a rally from the current price will yield around a 35% gain.
MATIC/USD daily chart

MATIC/USD daily chart

Support for Polygon begins at the 50% retracement of the 2020-2021 rally at $0.277, followed by the intersection of the 100-day SMA at $0.216 and the 61.8% Fibonacci retracement at $0.214. A further collapse would find little support and confirm that the altcoin outlook has shifted negatively.

Author

Sheldon McIntyre, CMT

Sheldon McIntyre, CMT

Independent Analyst

Sheldon has 24 years of investment experience holding various positions in companies based in the United States and Chile. His core competencies include BRIC and G-10 equity markets, swing and position trading and technical analysis.

More from Sheldon McIntyre, CMT
Share:

Editor's Picks

Bitcoin Weekly Forecast: BTC retreats as macro headwinds grow
Bitcoin (BTC) remains under pressure, down over 4% this week and trading around $76,900 at the time of writing on Friday. Institutional demand shows signs of weakness as spot BTC Exchange Traded Funds (ETFs) are on track to end their three-week inflow streak, recording nearly $500 million in net outflows through Thursday.
XRP falls toward key support as macro uncertainty, weak momentum cap recovery
Ripple (XRP) falls below $1.33 on Friday, marking the third consecutive day of declines. The token continues to track the broader cryptocurrency market downturn, with investors closely monitoring heightened macroeconomic uncertainty ahead of the United States (US) Consumer Price Index (CPI) release and next week’s Federal Reserve (Fed) monetary policy decision.
Crypto Today: Bitcoin, Ethereum, XRP stabilize at lower levels amid ETF outflows and macroeconomic risks
The broader cryptocurrency market is rising on Friday, with Bitcoin (BTC) trading above $77,000 after testing lower support near $76,500. Ethereum (ETH) shows signs of stability, hovering above the support provided at $2,400 despite capped upside at $2,500. Meanwhile, Ripple (XRP) holds above $1.33 after three straight days of declines, reflecting growing headwinds due to macroeconomic uncertainty.
Bitcoin pulls back as another golden cross fails to deliver
Earlier this week, Bitcoin formed a golden cross, a technical signal that occurs when the price’s 50-day moving average rises above the 200-day moving average and is conventionally viewed as a precursor to a bullish rally. Historically, however, that’s often not been the case.
Bitcoin: BTC retreats as macro headwinds grow
Bitcoin (BTC) remains under pressure, down over 4% this week and trading around $76,900 at the time of writing on Friday. Institutional demand shows signs of weakness as spot BTC Exchange Traded Funds (ETFs) are on track to end their three-week inflow streak, recording nearly $500 million in net outflows through Thursday.

