MATIC Price Prediction: Polygon has a clear path to $0.54, suggests on-chain metrics
- MATIC price had a breakout from a symmetrical triangle pattern on the 12-hour chart.
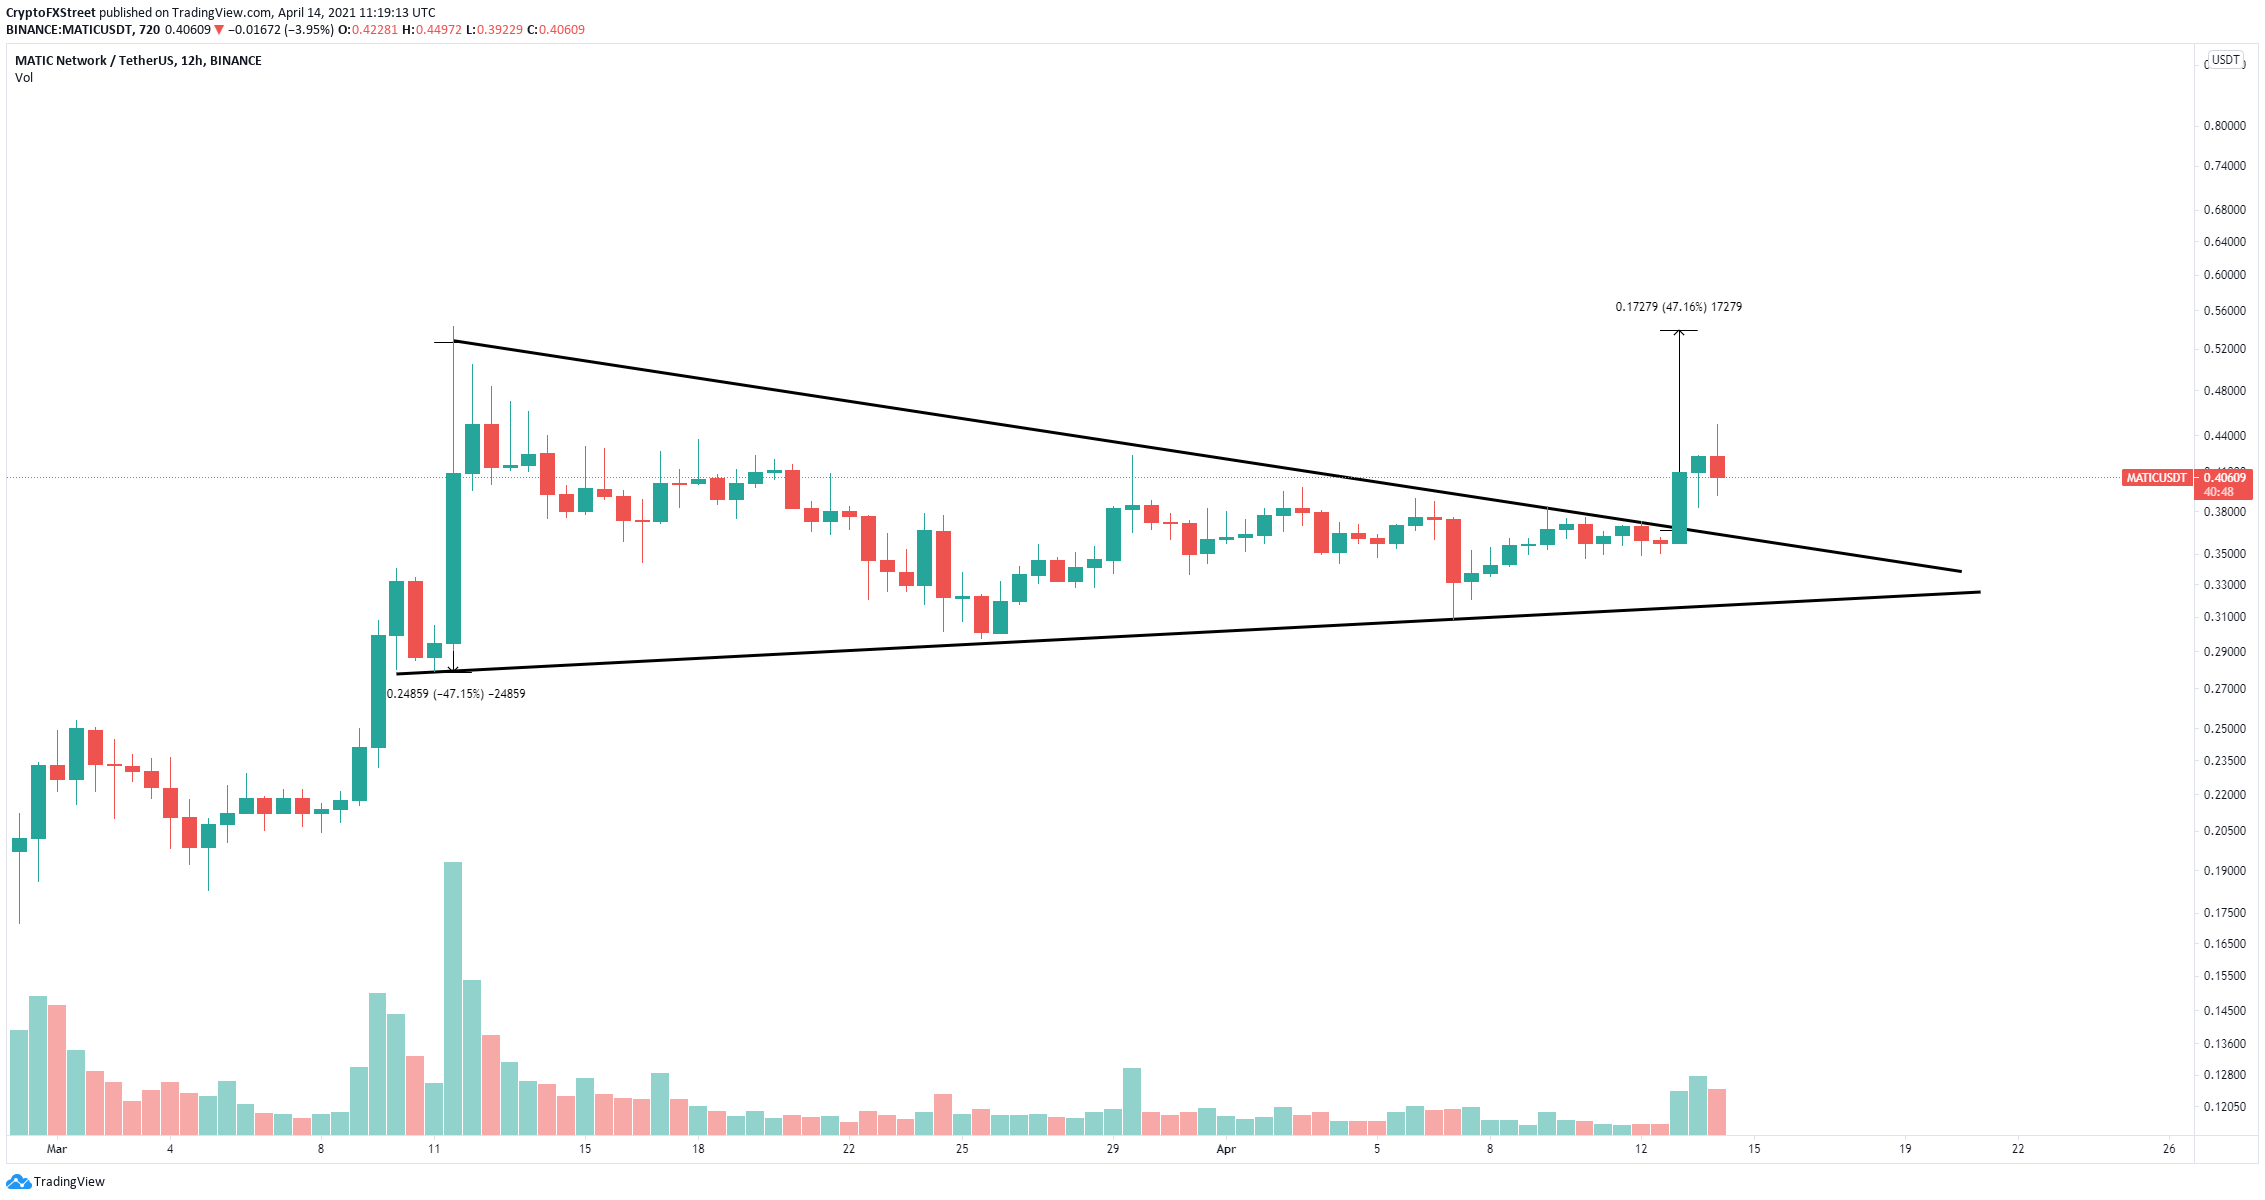
- The digital asset targets $0.54, which is the previous all-time high established on March 11.
- Whales continue to steadily accumulate MATIC despite rising prices.

MATIC has experienced a significant rally over the past two days, and although most on-chain metrics suggest the digital asset is poised for further gains, there is one key indicator that shows Polygon might need to see a correction first.
MATIC price targets previous all-time high
On the 12-hour chart, MATIC formed a symmetrical triangle pattern drawn by connecting the lower highs and higher lows with two trendlines that converge. On April 13, the digital asset broke out of the pattern and touched $0.449.
MATIC/USD 12-hour chart
This breakout's long-term price target is $0.54, calculated using the height from the beginning of the upper trendline to the beginning of the lower one.
MATIC IOMAP chart
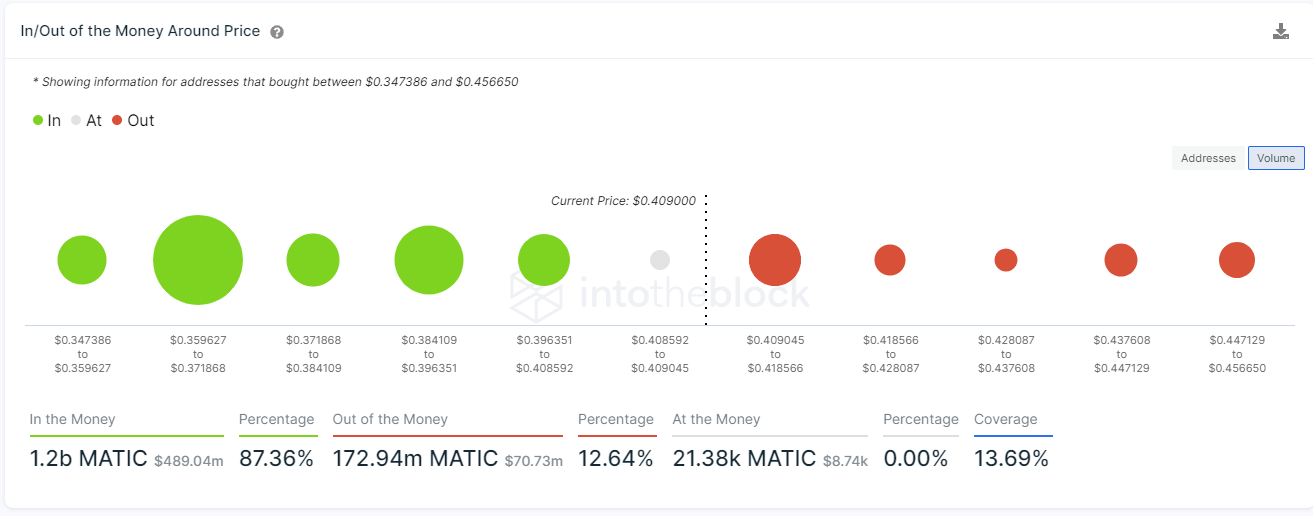
The In/Out of the Money Around Price (IOMAP) model shows only one significant resistance area between $0.409 and $0.418, where 2,130 addresses purchased 113 million MATIC. Climbing above this range should quickly push Polygon to the price target above as there are no other clear resistance levels ahead.
%20[13.21.08,%2014%20Apr,%202021].png)
MATIC Holders Distribution
Additionally, the number of whales holding 10,000,000 MATIC or more continues to increase, and it is up by six in the past ten days. Since the beginning of 2021, MATIC has gained 40 new whales, which indicates the interest in the digital asset is exceptionally high, and large investors are not taking profits just yet as they expect even higher prices.
MATIC/USD 4-hour chart
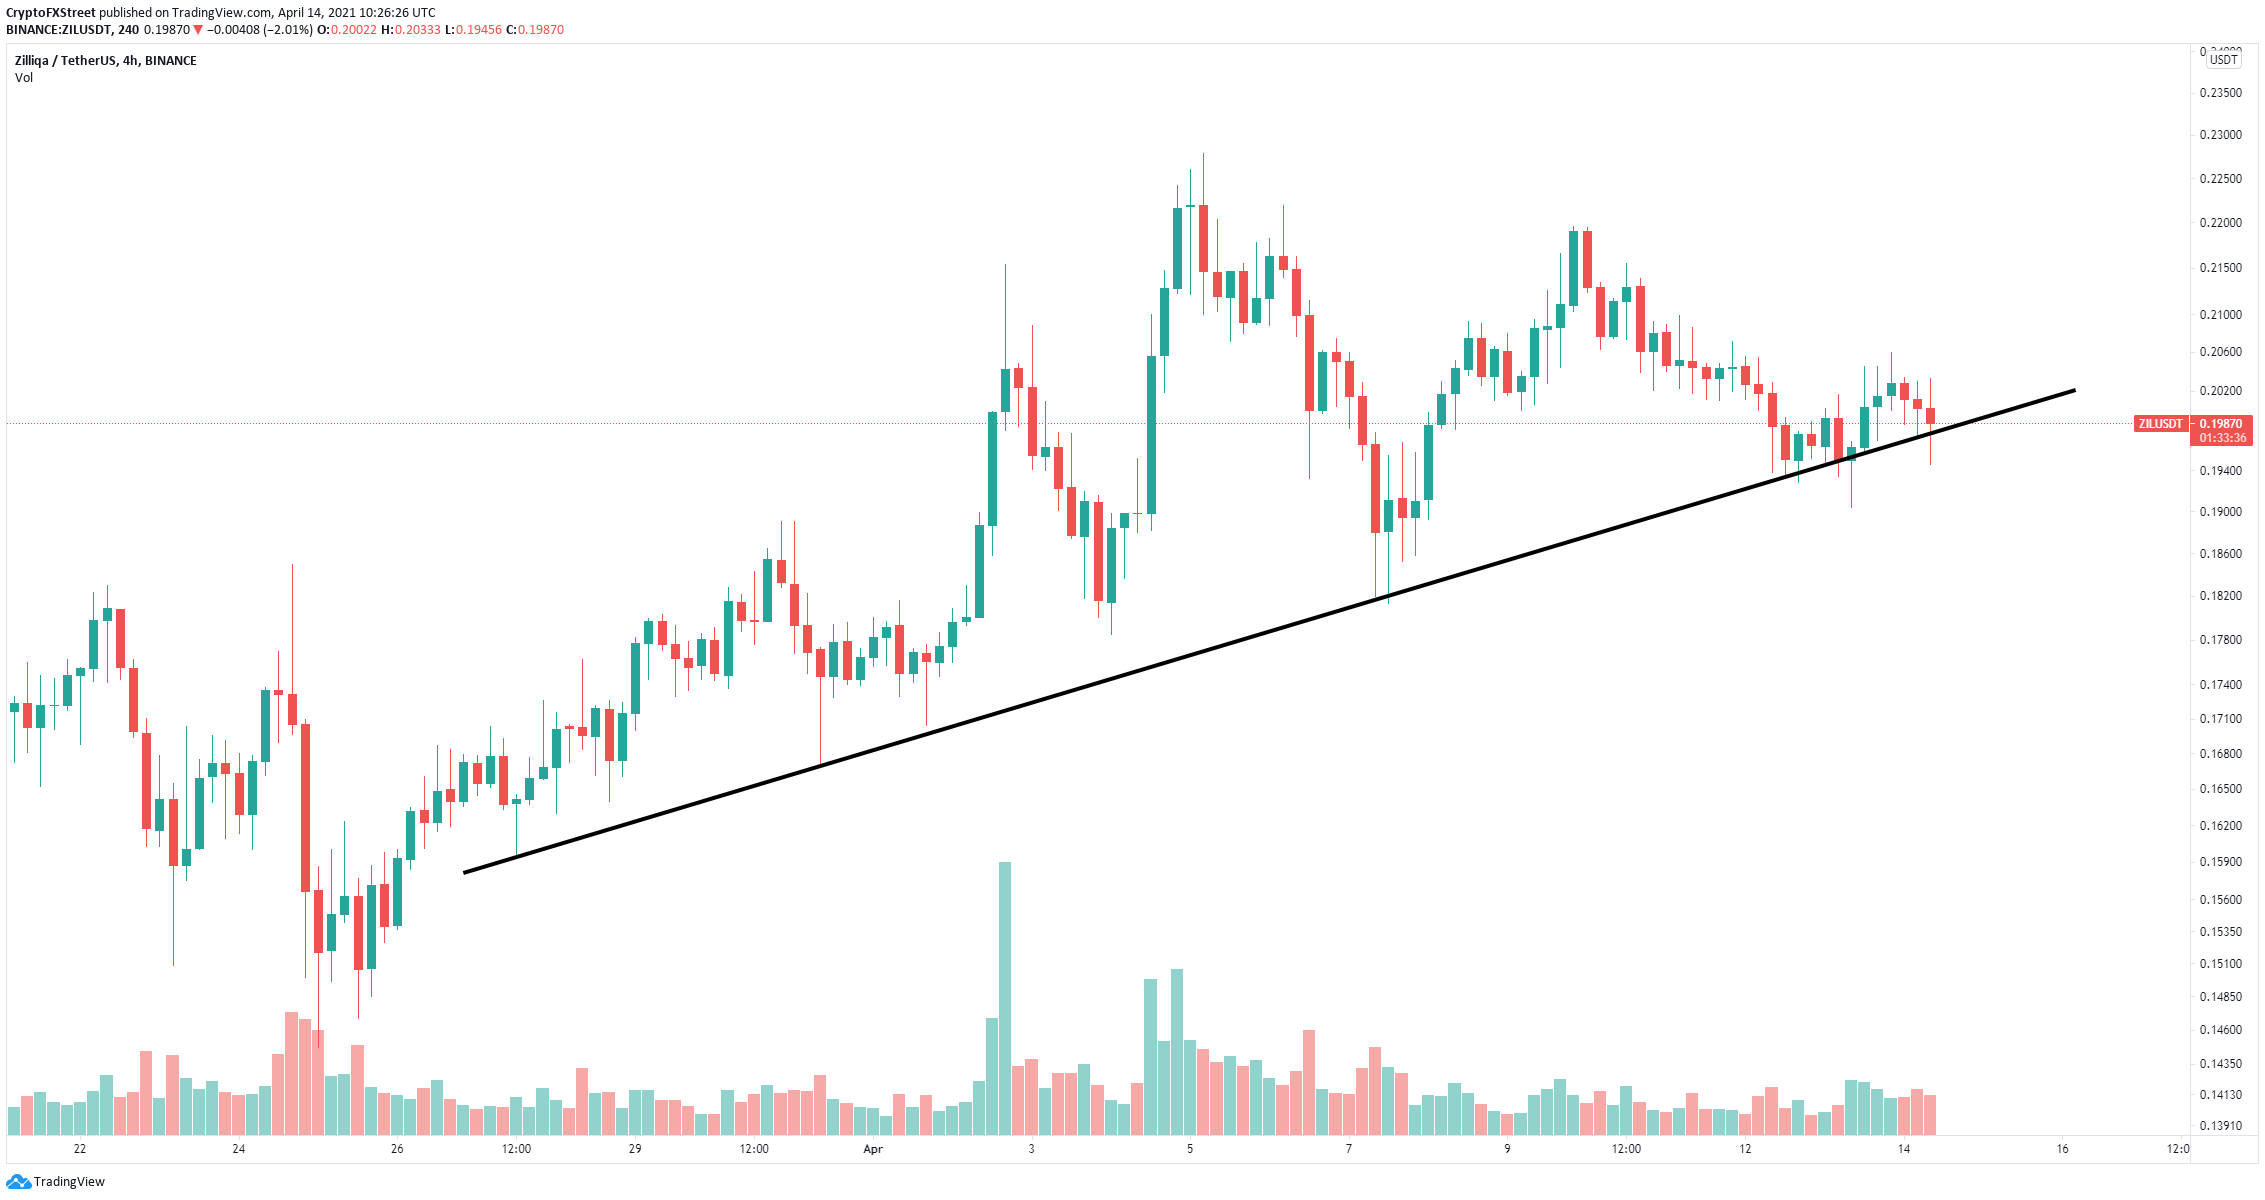
However, on the 4-hour chart, the TD Sequential indicator has just presented a sell signal, which has proven to be reliable in the past. The most significant support level is located at $0.367, where the 50 and 100 four-hour SMAs are currently established. This level coincides with the strongest support point indicated by the IOMAP model, where 6,000 addresses purchased over 576,000 MATIC.
Author

Lorenzo Stroe
Independent Analyst
Lorenzo is an experienced Technical Analyst and Content Writer who has been working in the cryptocurrency industry since 2012. He also has a passion for trading.



