MATIC price action looks to the upside with $1.6 in sight
- MATIC price action sees bulls picking up the dip on Sunday trading.
- Polygon price action looks bullish, with an uptick in the RSI pointing to a more bullish overweight.
- Expect to see a hit at $1.57, with the 55-day SMA forming a double layer on the topside.

Polygon (MATIC) price action sees bulls coming in and using the correction from Sunday as an opportunity to get long again as markets keep prepositioning for a breakthrough in peace talks. Although Russia is ramping up the inflammatory rhetoric, markets are choosing to overlook this, prefering to write it off as a tactic to broker a deal sooner rather than later. Expect a pop above a historic pivotal level and the 55-day Simple Moving Average (SMA) to $1.60.
MATIC price action set to jump 8% on a catalyst
MATIC price action sees momentum building and the scale tipping towards overweight bulls using any window of opportunity to get involved. This is reflected in the Relative Strength Index popping back up after the slight nudge during the sell-off on Sunday. As bulls are jumping in at lower levels compared to the highs of last week, the bull trade is becoming very crowded and might become a self-fulfilling prophecy with price action ramping up higher.
Polygon price action could see a big breakout towards $1.60, or an 8% jump, should a catalyst event trigger that breakout and provide a supporting tailwind to the trade. That would mean that bulls would punch through a bearish segment on the charts, with the historical level at $1.572 and the 55-day SMA forming a double layer of resistance to any upside. That would open the door for more room towards $1.75 with the 200-day SMA in the way and an even higher historic pivotal level just a few cents off one another.
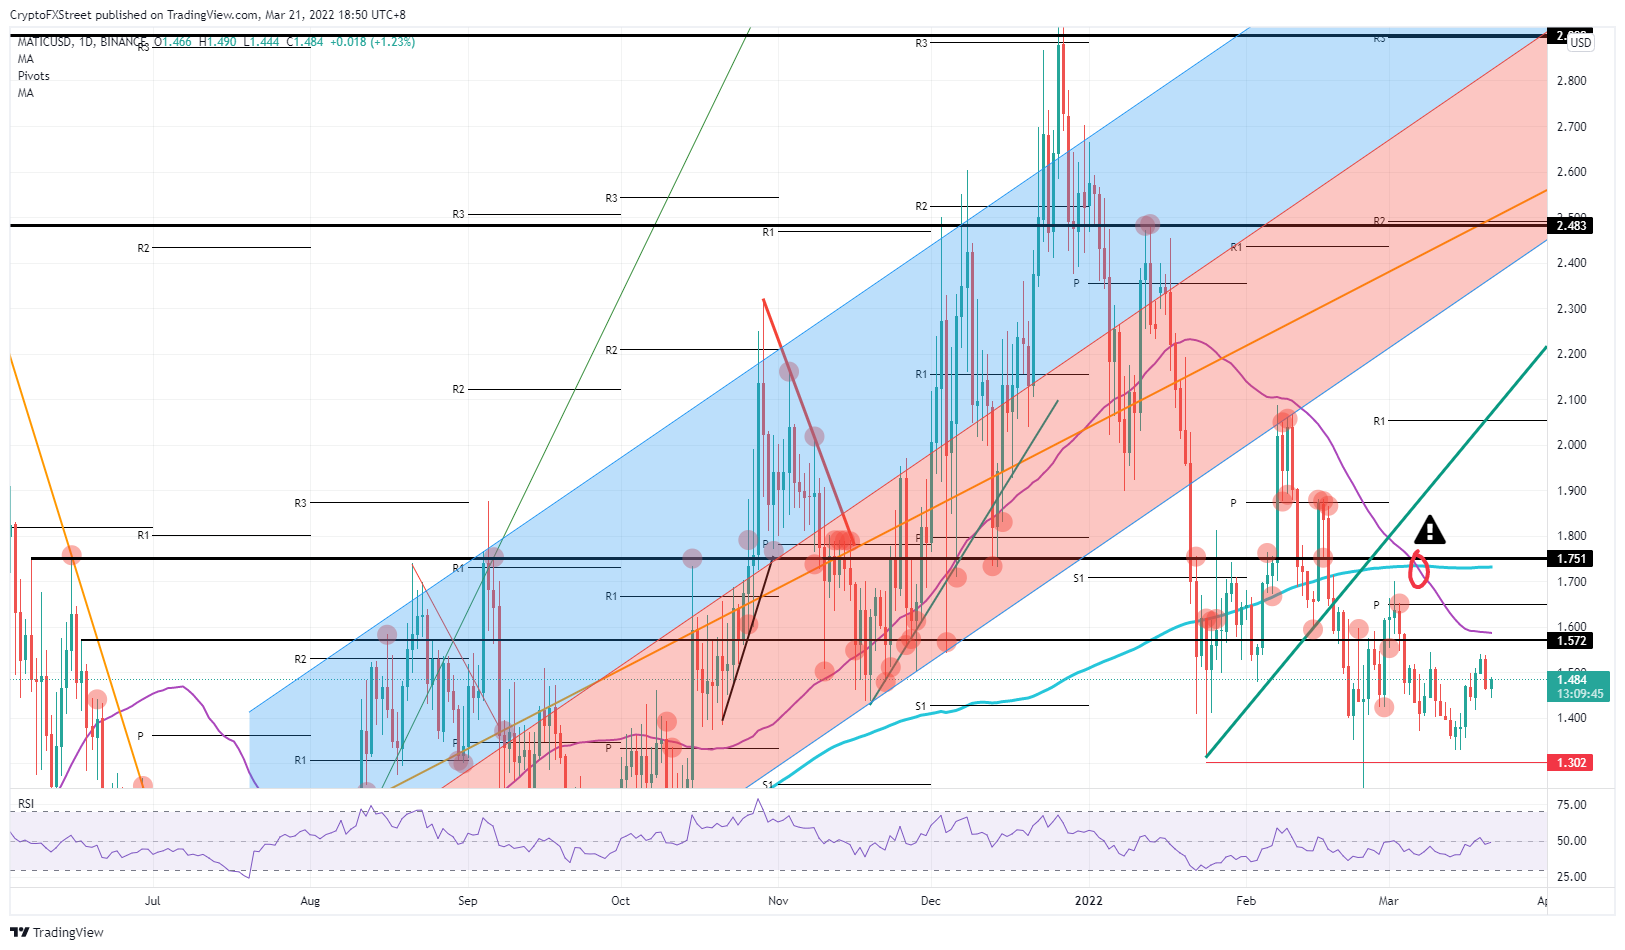
MATIC/USD daily chart
Risk to the downside could come from a spillover effect out of the stock market, with the S&P 500 index at a critical level, after the 55-day SMA moved below the 200-day SMA last week, forming a death cross, and price action currently trading at the 200-day SMA and undergoing some firm rejection. This has dead-cat bounce written all over it and could spark a big sell-off in the stock market, triggering a tsunami wave of risk-off, with cryptocurrencies getting slaughtered in the process. MATIC price action would drop back towards $1.30 and could even test the low of 2022, bearing a 13% loss.
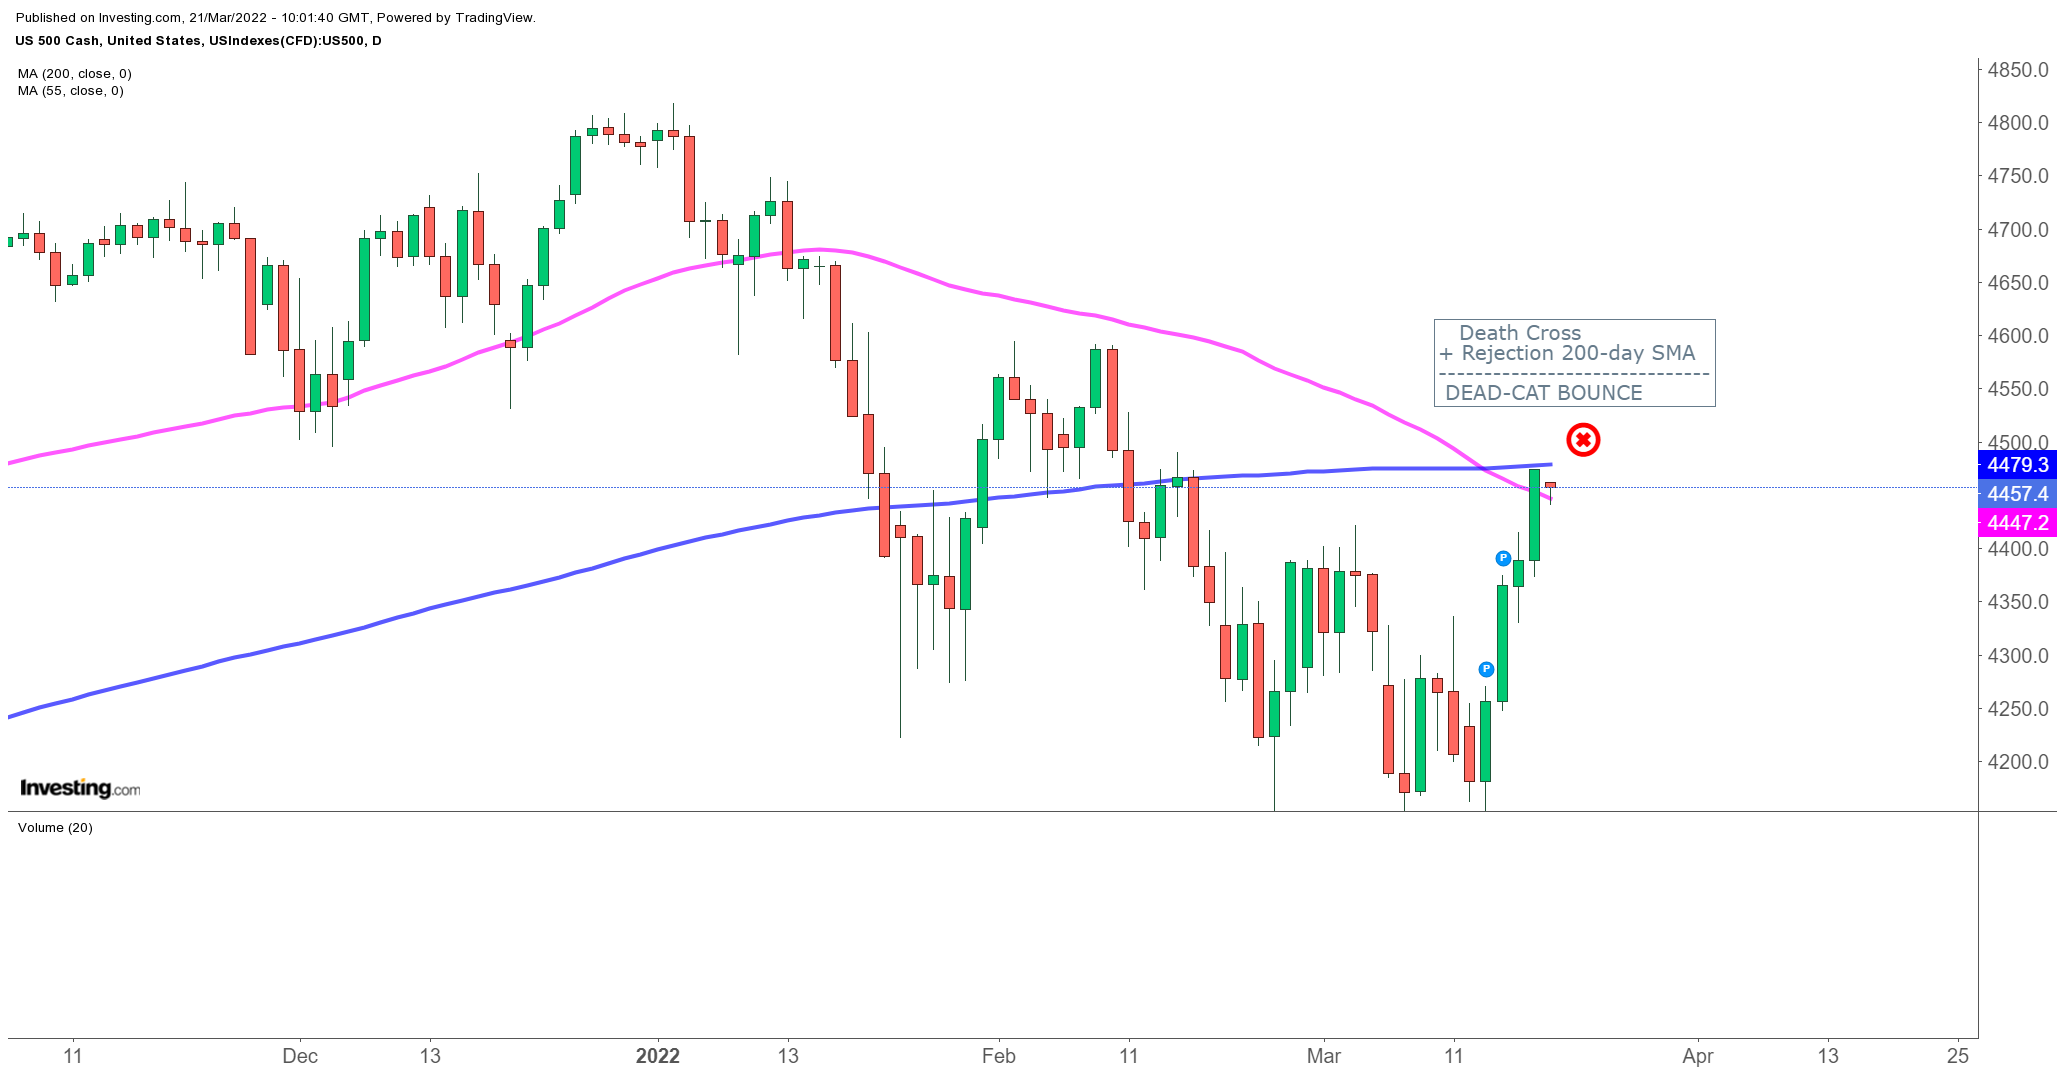
S&P 500 futures daily chart
Author

Filip Lagaart
FXStreet
Filip Lagaart is a former sales/trader with over 15 years of financial markets expertise under its belt.


