Maker price eyes a rally on technicals and on-chain metrics
- Maker price action shows bullish divergence on technical indicators, hinting at a reversal ahead.
- On-chain data paints a bullish picture, as MKR’s Exchange Flow Balance shows a negative spike.
- A daily candlestick close below $1,431 would invalidate the bullish thesis.

Maker (MKR) trades above $1,500 on Thursday, suggesting a potential rally as technical indicators show bullish divergence. This positive outlook is reinforced by MKR’s Exchange Flow Balance, which shows a negative spike, indicating growing investor confidence in the platform.
Maker price action shows bullish divergence on technical indicators
Maker price retested the descending trendline (drawn by connecting multiple high levels with a trendline from the end of July) on Monday and declined 5% in the next two days. This level roughly coincides with the daily resistance level at $1,669, making it a key resistance level. As of Thursday, it trades slightly higher at $1,561 and approaches the descending trendline.
Additionally, the formation of a lower low on the daily chart on September 18 contrasts with the Relative Strength Index (RSI) indicator's higher high during the same period. This development is termed a bullish divergence and often leads to the reversal of the trend that favors the bulls.
If Maker's price breaks above the descending trendline and closes above the daily resistance level at $1,669, it could rally 30% to retest its weekly resistance level of $2,175.
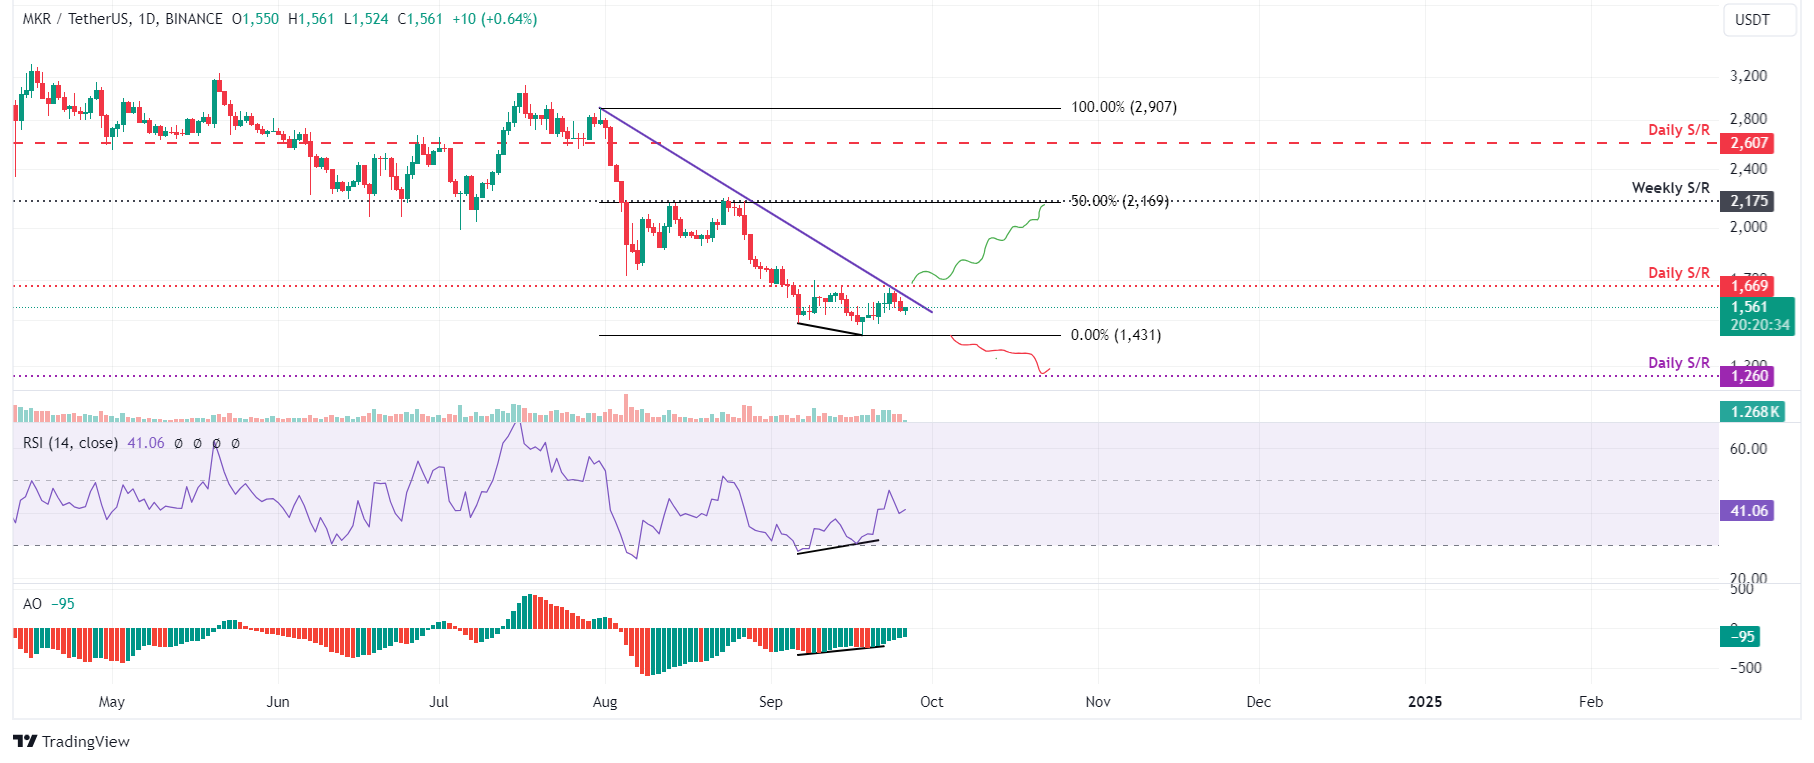
MKR/USDT daily chart
Santiment’s Exchange Flow Balance metric also shows a bullish outlook for Maker. This metric shows the net movement of Maker tokens into and out of exchange wallets. A rise in this metric indicates more MKR has entered the exchanges than exited, hinting at selling pressure from investors. Conversely, a fall in the metric indicates that more MKR left the exchange than entered, indicating less selling pressure from investors.
As in Maker’s case, the metric fell from -191 MKR on September 16 to -42,770 MKR on September 17. This fall indicates increasing confidence among investors as holders remove Maker tokens from exchanges and store them in cold wallets.
%20[09.02.43,%2026%20Sep,%202024]-638629227954695583.png)
Maker Exchange Flow Balance Chart
On the other hand, if MKR's daily candlestick closes below $1,431, it would invalidate the bullish thesis by forming a lower low on the daily timeframe. This development could lead to a 12% crash in Maker's price to retest its daily support level at $1,260.
Author

Manish Chhetri
FXStreet
Manish Chhetri is a crypto specialist with over four years of experience in the cryptocurrency industry.


