LUNC chart indicates a potential 10% breakout after weeks of consolidation
- Luna Classic price appears ready for a breakout after weeks of horizontal consolidation.
- LUNC could surge 10% to breach the $0.000135 resistance level.
- A daily close below the immediate support at $0.000120 could invalidate the altcoin’s bullish thesis.

Luna Classic price (LUNC) has been trading horizontally for weeks after a rejection from a crucial resistance level. The consolidation came amid growing overhead pressure coupled with general market FUD that prevented LUNC from riding the alt season. However, the recent burn event seems to have stirred things up for the altcoin and now a breakout seems imminent.
Burn alert! 1,612,903,453 #LUNC ($203,000) burned to Luna Burn Wallet!https://t.co/EcWejVgy5P#BurnLunc #LuncArmy
— LunaBurnTracker (@LunaBurnTracker) April 1, 2023
A total of 1,612,903,453 LUNC worth $203,000 at the time of the transaction was taken out of Luna Classic’s market supply forever on April 1, courtesy of Binance. The move solidified the giant exchange’s position as the highest contributor to the Terra Classic burn expedition with over 30.5 billion LUNC tokens burned.
Luna Classic price readies for a 10% breakout
Luna Classic price appears ready for a 10% breakout after weeks of consolidation. The newly found momentum is attributed to Binance’s move to reduce the total supply of LUNC. On April 1, the leading crypto exchange by trading volume sent 50% of the trading fees generated from LUNC spot and margin trades in March to the community burn wallet.
If LUNC bulls take advantage of the pump, Luna Classic price could break above the descending trendline and kickstart a rally north. A decisive flip of the resistance offered the downtrend line into a support could pave the way for 10% gains for LUNC. This move would deliver the altcoin to the $0.000135 resistance level.
If buyer momentum grows above this level, Luna Classic price could attempt to reclaim the March 17 highs around $0.000141 by overcoming the 50-day Exponential Moving Average (EMA) at $0.000137. In highly bullish cases, LUNC could continue northbound towards the 100-day and the 200-day EMAs at $0.000154 and $0.000188, respectively.
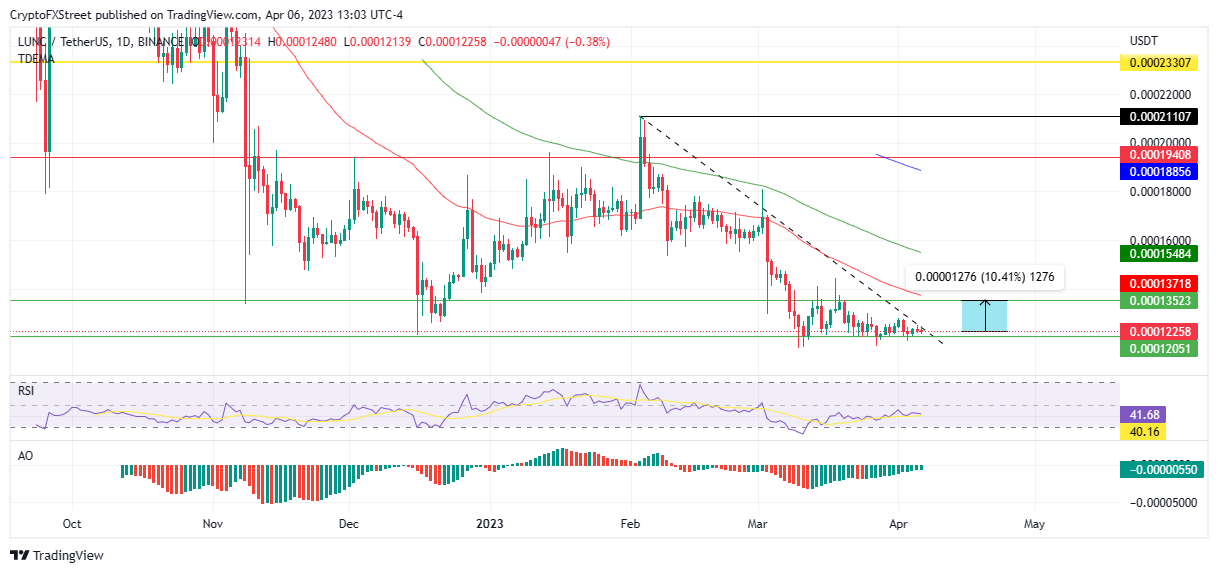
LUNC/USDT 1-day chart
Conversely, if LUNC bulls are unable to increase momentum, Luna Classic price could fail to break above the downtrend line, leading to a continued downtrend. This could see the altcoin lose the immediate support level at $0.000120, thereby invalidating the bullish thesis.
A continued downtrend could see Luna Classic price drop lower to collect sell-side liquidity around the psychological $0.000117 support level.
Traders should probably take advantage of the current dip in Luna Classic price to acquire LUNC at affordable rates before the breakout begins.
Author

Lockridge Okoth
FXStreet
Lockridge is a believer in the transformative power of crypto and the blockchain industry.



