Litecoin price sets for a rally following the breakout of a falling wedge
- Litecoin price breaks above the falling wedge pattern, signaling a potential bullish uptrend ahead.
- Network Realized Profit/Loss metric shows LTC's capitulation event on July 15.
- A daily candlestick close below $56.61 would invalidate the bullish thesis.

Litecoin (LTC) price broke above the falling wedge pattern on Monday, trading 1.36% higher on Tuesday. On-chain data highlights a capitulation event for LTC on July 15, potentially signaling forthcoming bullish momentum.
Litecoin price looks promising for a rally
Litecoin price broke above the falling wedge pattern on Monday. This pattern is formed by connecting swing highs and lows with trendlines from mid-March to mid-July. A breakout of this pattern signals a potential bullish trend. As of Tuesday, LTC is trading slightly higher by 1.36%, at $73.34.
If the upper trendline of the falling wedge pattern holds as throwback support at around $69.91, LTC could rally 10% from that level, targeting its daily resistance of $77.33.
On the daily chart, the Relative Strength Index (RSI) is currently above the neutral level of 50, and the Awesome Oscillator (AO) is also approaching its threshold. Both indicators must maintain their positions above average for the bullish momentum to be sustained. This scenario would contribute additional momentum to the ongoing recovery rally.
Furthermore, surpassing the $77.33 level could pave the way for an additional 18% rally to retest $91.49, a 61.8% Fibonacci retracement level drawn from a swing high of $112.80 from April 1 to a swing low of $57.01 from July 5.
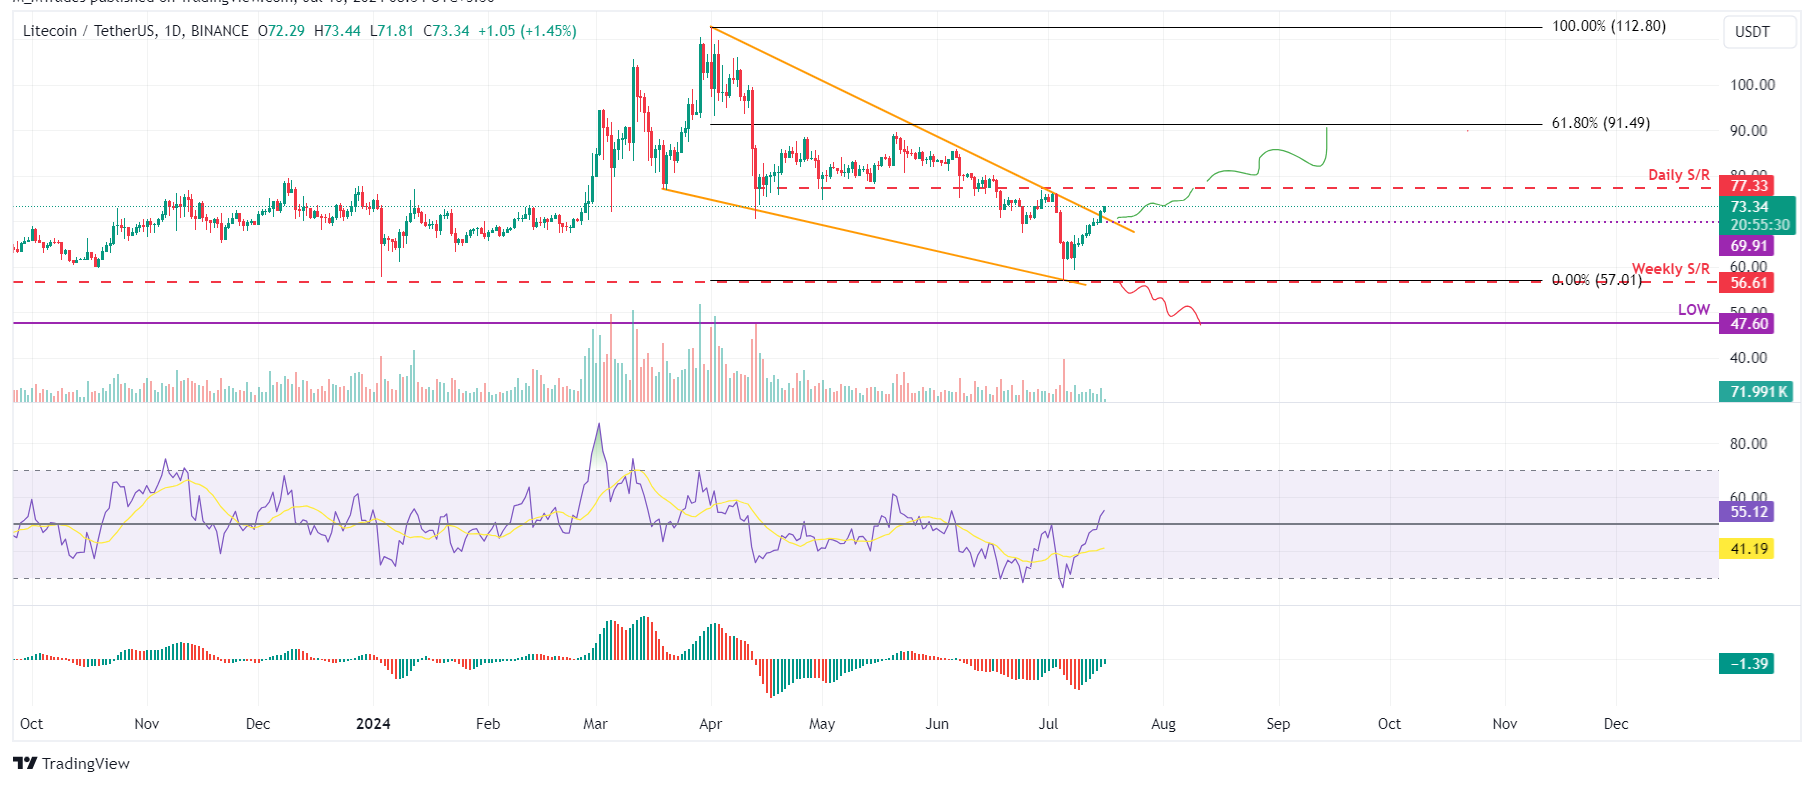
LTC/USDT daily chart
Based on IntoTheBlock's Global In/Out of the Money (GIOM), nearly 700,390 addresses accumulated 9.17 million LTC tokens at an average price of $69.57. These addresses bought Litecoin between $67.76 and $72.06, which makes it a key support zone. These investors will likely add more to their holdings if the price retraces.
Interestingly, the $67.76 to $72.06 zone mentioned from a technical analysis perspective coincides with the GIOM findings, making this zone a key reversal area to watch.
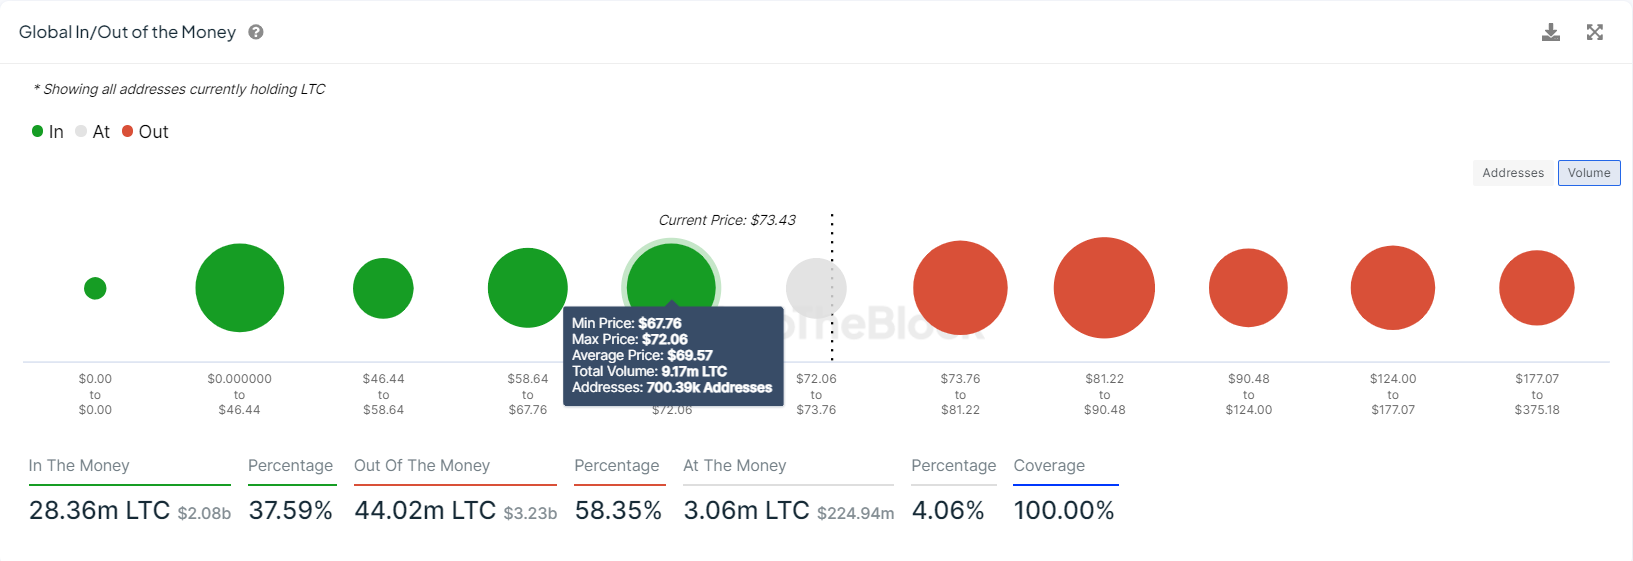
LTC GIOM chart
On-chain data provider Santiment's Network Realized Profit/Loss (NPL) indicator computes a daily network-level Return On Investment (ROI) based on the coin's on-chain transaction volume. Simply put, it is used to measure market pain. Strong spikes in a coin's NPL indicate that its holders are, on average, selling their bags at a significant profit. On the other hand, strong dips imply that the coin's holders are, on average, realizing losses, suggesting panic sell-offs and investor capitulation.
In LTC's case, the NPL indicator spiked from 237,220 on July 14 to -5.25 million on July 15. This massive negative downtick indicates that the holders are, on average, realizing losses, suggesting panic sell-offs and investor capitulation.
%20[08.36.07,%2016%20Jul,%202024]-638567000575750217.png)
LTC Network Realized Profit/Loss (NPL) chart
Despite the bullish thesis signaled by both on-chain data and technical analysis, if Litecoin's daily candlestick closes below $56.61, the outlook will shift to bearish. This scenario could lead to a 16% crash to retest its low of $47.60 on November 9, 2022.
Author

Manish Chhetri
FXStreet
Manish Chhetri is a crypto specialist with over four years of experience in the cryptocurrency industry.


