Whales propel Litecoin recovery with strategic dip-buying surge
- Litecoin retests weekly support at $56.61, bounces 5%, and trades at $62.26 on Tuesday.
- Network Realized Profit/Loss metric shows a capitulation event on July 5.
- Supply Distribution reveals that one cohort of whales seized the opportunity and bought LTC dips.
- A daily candlestick close below $56.61 would invalidate the bullish thesis.

Litecoin (LTC) retested weekly support at $56.61, bounced 5%, and is trading 0.39% higher at $62.20 on Tuesday. On-chain data suggests that specific whales leveraged the market downturn to accumulate LTC, potentially signaling bullish momentum in the upcoming days.
Litecoin looks promising
Litecoin price trades inside a falling wedge pattern, formed by joining multiple swing high and swing low levels by a trendline.
LTC price was rejected by the trendline's upper band on July 3, roughly around the $77.33 level, and crashed 19.43% in the next two days.
LTC retests the weekly support for around the $56.61 level, bounces back 5% and currently trades at $65.20.
If the weekly support holds, LTC could rally 9% to retest the upper band of the falling wedge pattern, which is roughly $71.20.
The Relative Strength Index (RSI) and the Awesome Oscillator (AO) on the daily chart are trading below the neutral thresholds of 50 and zero, respectively. For bulls to sustain momentum, both indicators must rise above these critical levels, potentially supporting the ongoing recovery rally.
If LTC breaks above the upper band of the falling wedge pattern and closes above the $77.33 daily resistance level, LTC could extend an additional rally of 19% to retest $91.49, a 61.8% Fibonacci retracement level drawn from a swing high of $112.80 from April 1 to a swing low of $57.01 from July 5.
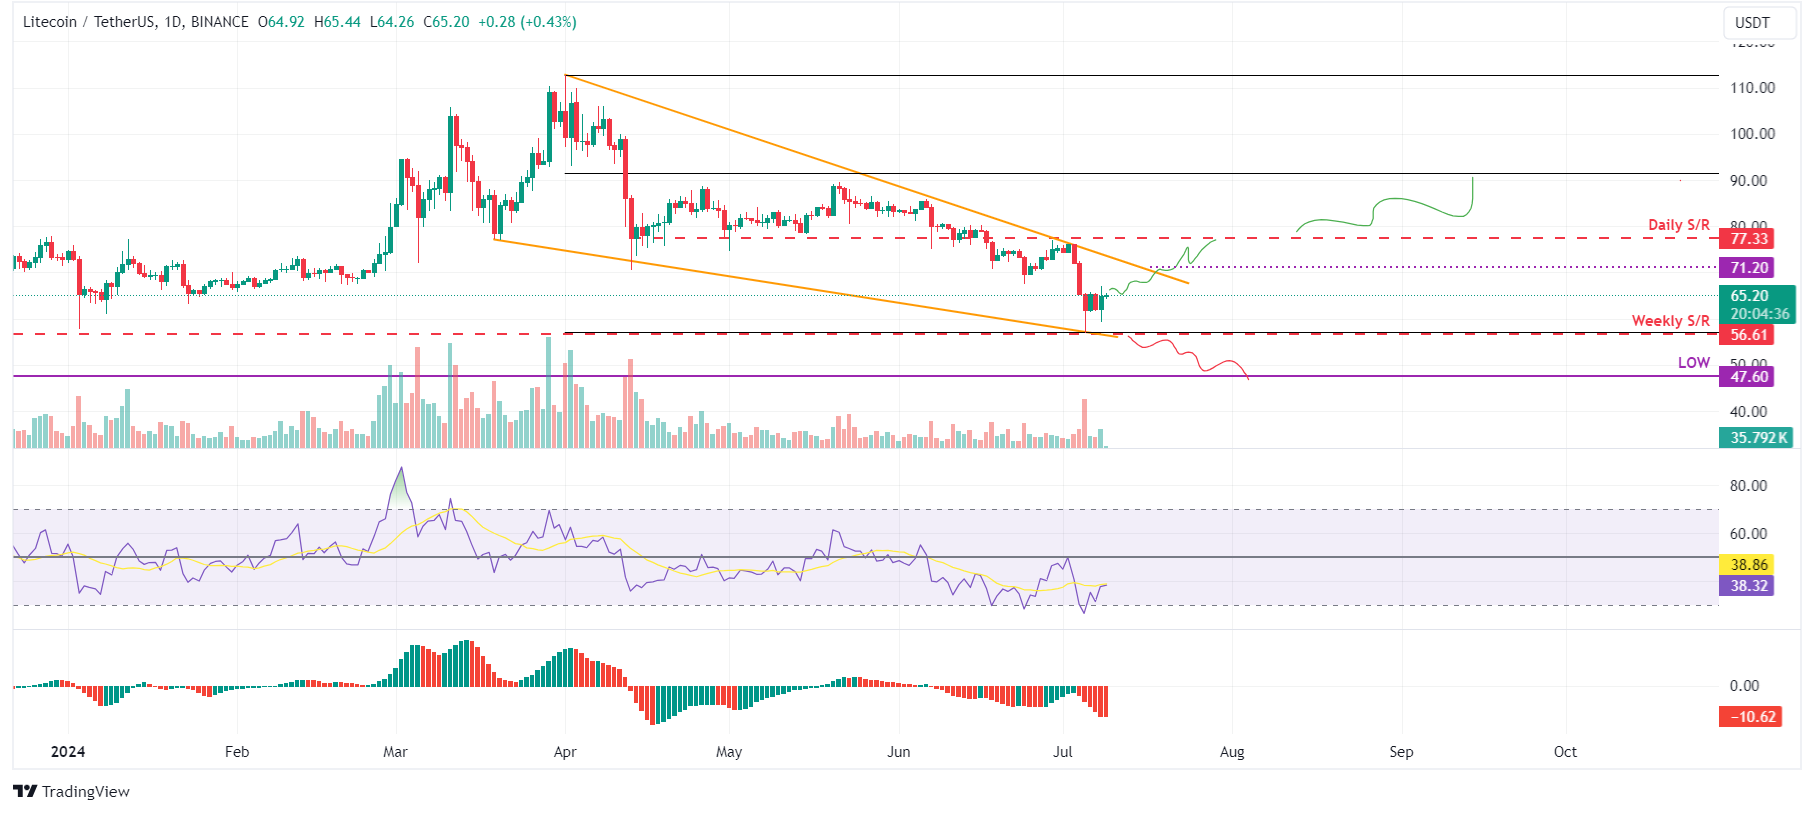
LTC/USDT daily chart
On-chain data provider Santiment’s Network Realized Profit/Loss (NPL) indicator computes a daily network-level Return On Investment (ROI) based on the coin’s on-chain transaction volume. Simply put, it is used to measure market pain. Strong spikes in a coin’s NPL indicate that its holders are, on average, selling their bags at a significant profit. On the other hand, strong dips imply that the coin’s holders are, on average, realizing losses, suggesting panic sell-offs and investor capitulation.
In LTC’s case, the NPL indicator spiked from -349,110 on July 2 to -14.7 on July 5, coinciding with a 19.25% price crash. This massive negative downtick indicates that the holders are, on average, realizing losses, suggesting panic sell-offs and investor capitulation.
%20[08.54.43,%2009%20Jul,%202024]-638560948769290663.png)
LTC Network Realized Profit/Loss chart
Santiment’s Supply Distribution metric shows that whales with 100,000 to 1 million LTC tokens dropped from 27.55 million to 26.41 million from July 5. Meanwhile, wallets holding 1 million to 10 million LTC surged from 6.71 million to 7.71 million in the same period.
This interesting development shows that the first cohort of whales could have fallen prey to the capitulation event. In contrast, the second set of wallets seized the opportunity and accumulated LTC at a discount.
%20[08.17.24,%2009%20Jul,%202024]-638560949089075861.png)
LTC Supply Distribution chart
Even though on-chain metrics and technical analysis point to a bullish outlook, if LTC's price makes a daily candlestick close below $56.61, the bullish thesis would be invalidated by creating a lower low on the daily chart. This development could see Litecoin’s price decline by 16% to retest its low of $47.60 on November 9, 2022.
Author

Manish Chhetri
FXStreet
Manish Chhetri is a crypto specialist with over four years of experience in the cryptocurrency industry.


