Litecoin Price Prediction: LTC marches toward new all-time highs
- Litecoin price reaches measured move target in just two weeks.
- Weekly Relative Strength Index (RSI) flashing bearish momentum divergence.
- Volume profile remains robust with higher volume on positive days and lighter volume on negative days.

Litecoin price has been the beneficiary of the broader strength in the cryptocurrency complex. Still, the robustness of volume shows a belief in the underlying LTC fundamentals and its future. However, upside may be limited in the short term as the rally consolidates around the confluence of the measured move target and the 61.8% retracement of the 2017-2018 bear market before capitalizing on the conviction for a new all-time high.
Litecoin price unphased by Bitcoin’s struggles with new highs
The breakout from a symmetrical triangle pattern began with a whimper on April 3 but soon ignited and rallied LTC close to the measured move target of $292.20, a gain of 38% from the triangle breakout.
A broad swath of technical data supports a continuation of the rally, but the bearish momentum divergence on the weekly RSI does raise some caution for speculators. A bearish momentum divergence occurs when the price makes a new high, but the RSI prints a lower high.
Nevertheless, the breakout conviction has established the basis for LTC to potentially rally a further 47% and knock on the all-time high of $420.00. Some resistance will come into play at the 78.6% retracement of the 2017-2018 bear market at $334.88, but after that, the path is open for new all-time highs.
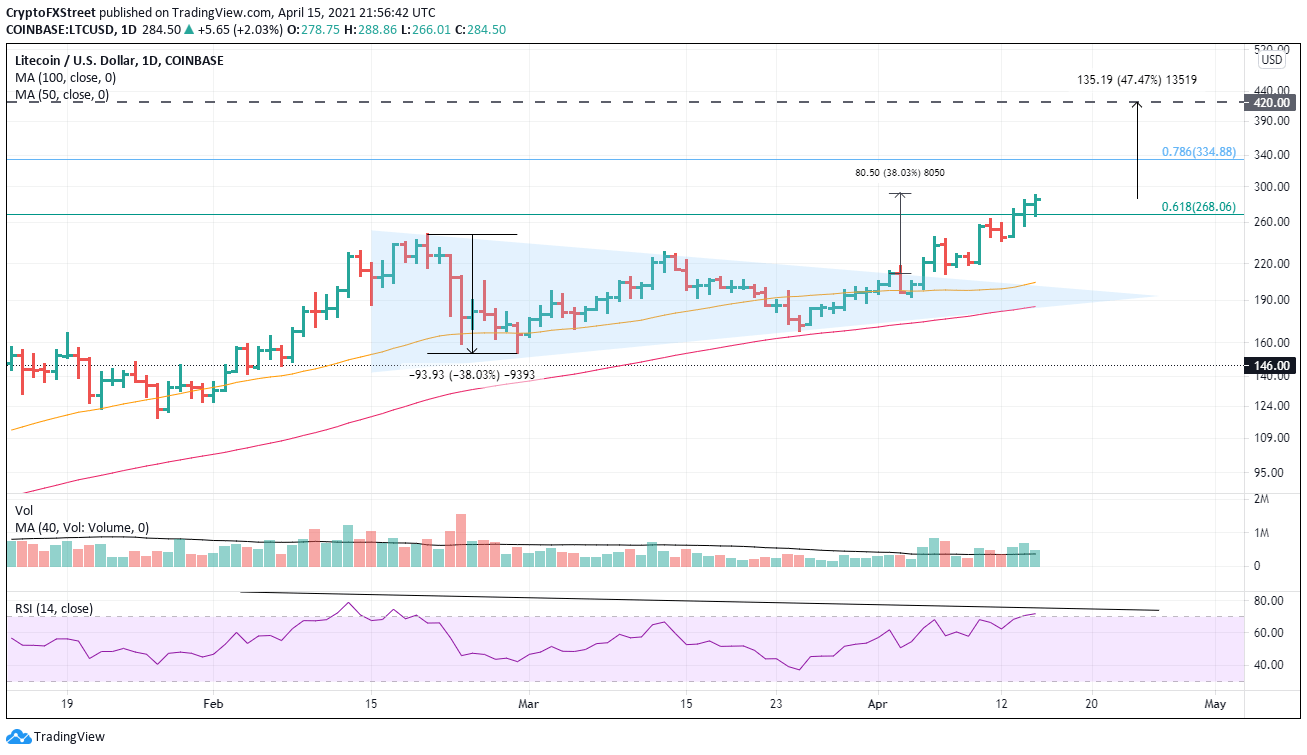
LTC/USD daily chart
If a consolidation emerges, it should find support in the area of the February 20 high at $247. A failure to hold would put the rally in question and expose LTC to a decline to the 50-day simple moving average (SMA) at $204.11.
Author

Sheldon McIntyre, CMT
Independent Analyst
Sheldon has 24 years of investment experience holding various positions in companies based in the United States and Chile. His core competencies include BRIC and G-10 equity markets, swing and position trading and technical analysis.


