Litecoin Price Forecast: LTC could crash 65% if its bearish fate plays out
- Litecoin price shows a bear flag pattern hinting at a 64% crash.
- LTC has already triggered a breakdown, suggesting that this pessimistic outlook is at play.
- A daily candlestick close above $64.43 will invalidate the bearish thesis.

Litecoin price shows a rather bearish outlook from a higher time frame perspective, which hints at a steep correction awaiting the altcoin. To make matters worse, this pattern has already confirmed a breakdown, indicating that the fate of LTC holders has already been decided.
Litecoin price shows its hand
Litecoin price shed roughly 64% between April 1 and June 12, which pushed it down from $128 to $51. This steep correction was followed by a recovery phase that pushed LTC up by 62% in the next three months.
So, between April and September, Litecoin price action led to the formation of a bear flag on the charts, which is a form of bearish continuation pattern, signaling more losses ahead. As the name suggests, the pattern looks like a flag on a pole, only in the case of the bearish version ‘upside-down’.
In this case, the 64% correction is the flagpole, while the 62% recovery rally in the form of higher highs and higher lows formed the flag.
The setup forecasts a continuation of the bear trend for Litecoin price. The target for this technical pattern is obtained by measuring the flagpole’s height and extrapolating it from the flag lower. Starting from a breakout point at $55 it reveals that LTC could slide to $19.74. However, a conservative target would be $24.
The market conditions suggest that investors should pay close attention to $41.68 and the liquidity below it. If Litecoin price sweeps below this level and recovers quickly, investors should consider a potential early end to the downside move.
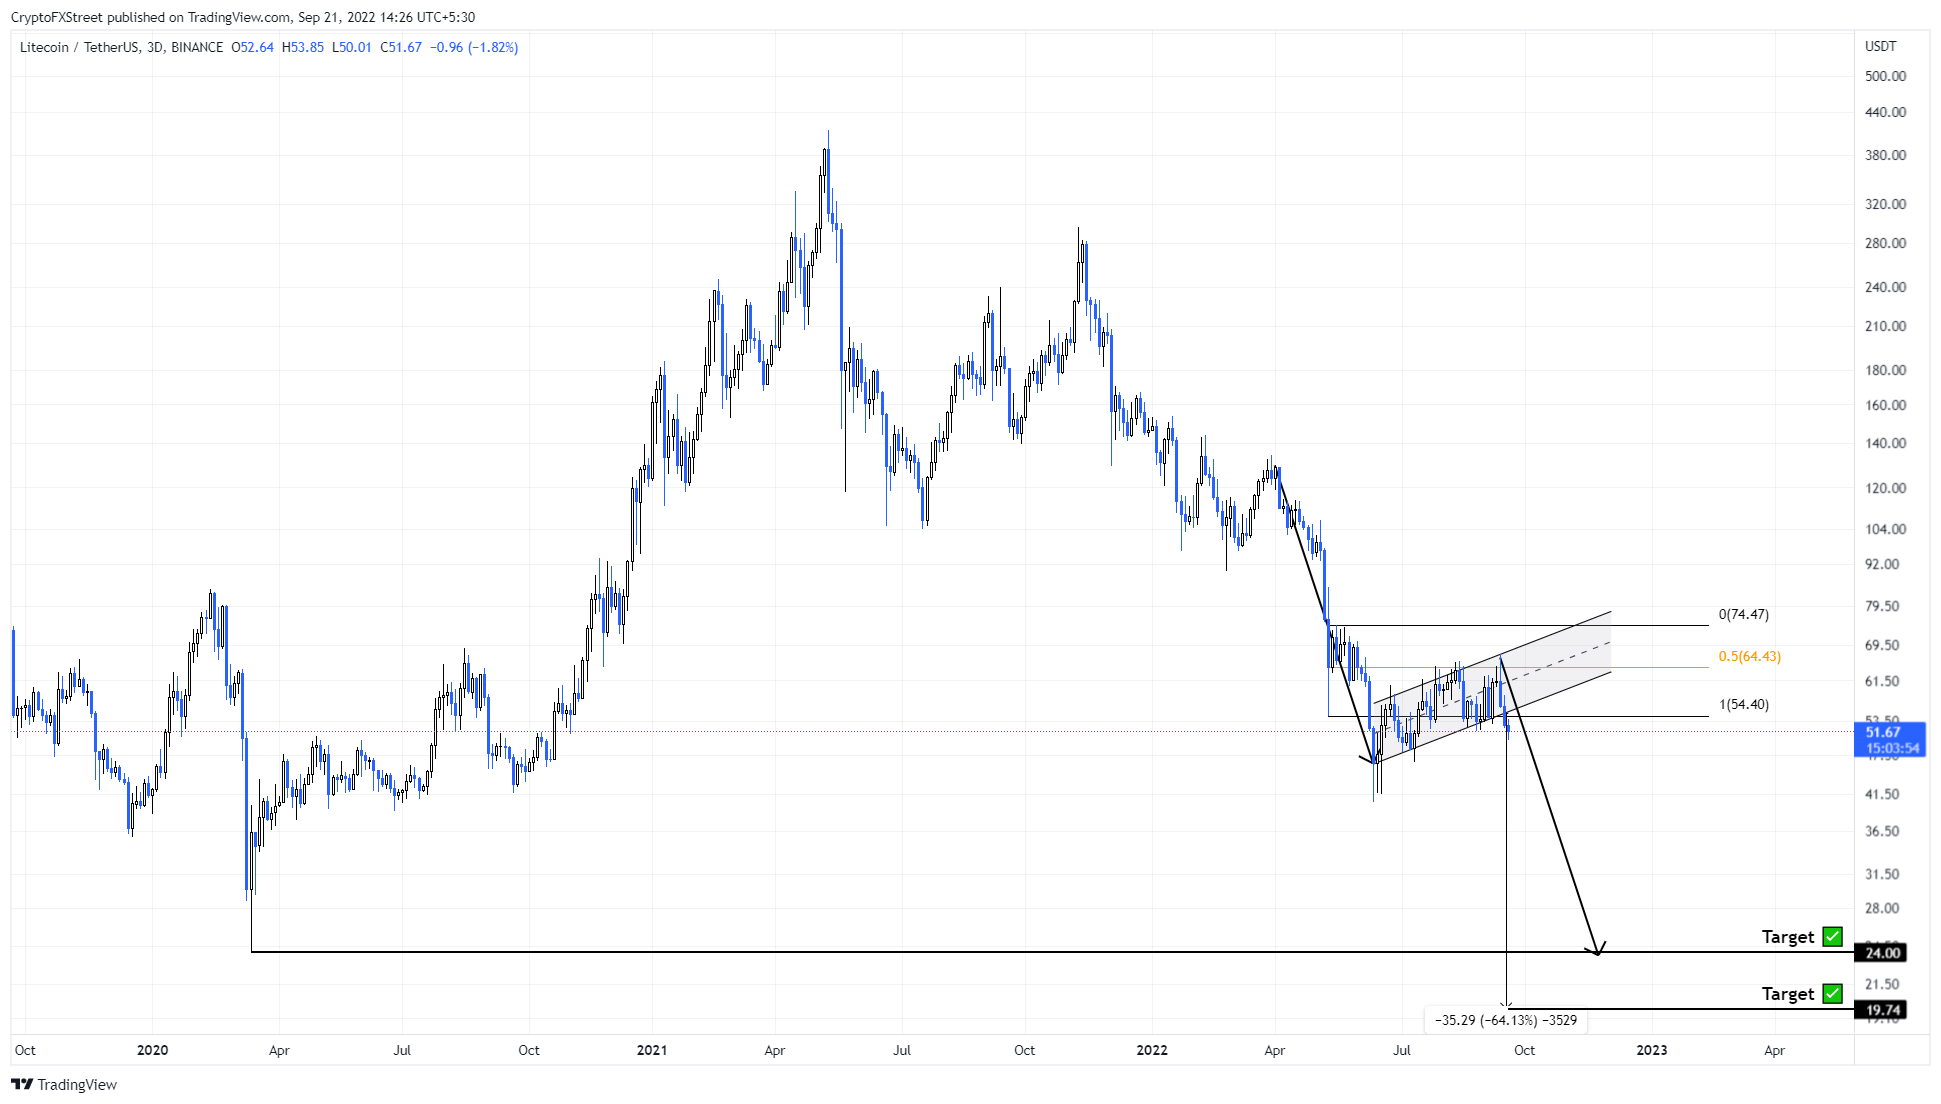
LTC/USDT 3-day chart
On the other hand, if Litecoin price produces a daily candlestick close above the $54.40 to $74.47 range’s midpoint at $64.43, it will indicate a weak sell-side camp. Moreover, this move will allow bulls to take control, invalidating the bearish thesis for LTC.
In such a case, market participants can expect Litecoin price to attempt a retest of the range high at $74.47.
Note:
The video attached below talks about Bitcoin price and its potential outlook, which could influence Litecoin price.
Author

Akash Girimath
FXStreet
Akash Girimath is a Mechanical Engineer interested in the chaos of the financial markets. Trying to make sense of this convoluted yet fascinating space, he switched his engineering job to become a crypto reporter and analyst.



