Litecoin (LTC) Price Analysis: LTC/USD on a trip to the South; the next stop is $40.00
- LTC/USD has been moving inside a tight range with a bearish bias.
- The pivotal support is located on the approach to $40.00.

Litecoin (LTC), the sixth-largest digital asset with the current market capitalization of $2.8 billion, has been losing ground gradually. LTC/USD has lost about 1.5% of its value in recent 24 hours to trade at $43.40 at the time of writing.
In the absence of the relevant fundamental news, LTC/USD is moving sync with the market, vulnerable to bearish sentiments ahead of the holiday season. As the liquidity is decreasing, the coin may demonstrate sharp movements in either direction.
Litecoin's technical picture
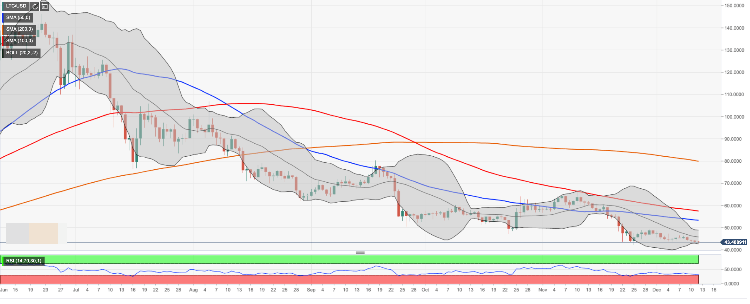
On a daily chart, LTC/USD is sliding down inside a narrowing range, with the initial support located at psychological $43.00. This barrier stopped the sell-off during early Asian hours. If it is broken, the lower line of the daily Bollinger Band at $42.70 and the lowest level of the previous month $42.16 will come into focus. Once it is broken, the sell-off may be extended towards the psychological $40.00. This support is likely to slowdowns the bears and initiate an upside correction. Otherwise, the bearish trend will tricker more sell orders and exacerbate the decline.
On the upside, the initial upside barrier is created by the middle line of the daily Bollinger Band currently at $45.80. It is followed by $48.50 ( the upper edge of the daily Bollinger Band) and psychologic $50.00. If the price moves above this barrier, the upside momentum will increase and allow for a recovery to the pivotal resistance created by SMA50 (Simple Moving Average) daily at $53.35. LTC/USD has been trading below this line since November 18. Another strong resistance awaits us on approach to $58.00 (SMA100 daily) and $59.50 (SMA50 weekly).
The daily RSI (Relative Strength Index) is flat, close to the oversold territory, which implies that the coin is likely to continue range-bound trading with bearish bias.
LTC/USD, the daily chart
Author

Tanya Abrosimova
Independent Analyst


