Litecoin bulls must hold $180 or bears will push LTC price to $140
- Litecoin price rejected from moving above $200.
- Head-and-shoulders pattern warns of strong moves lower, surpassing August lows.
- Oscillator values void any near-term support holding.

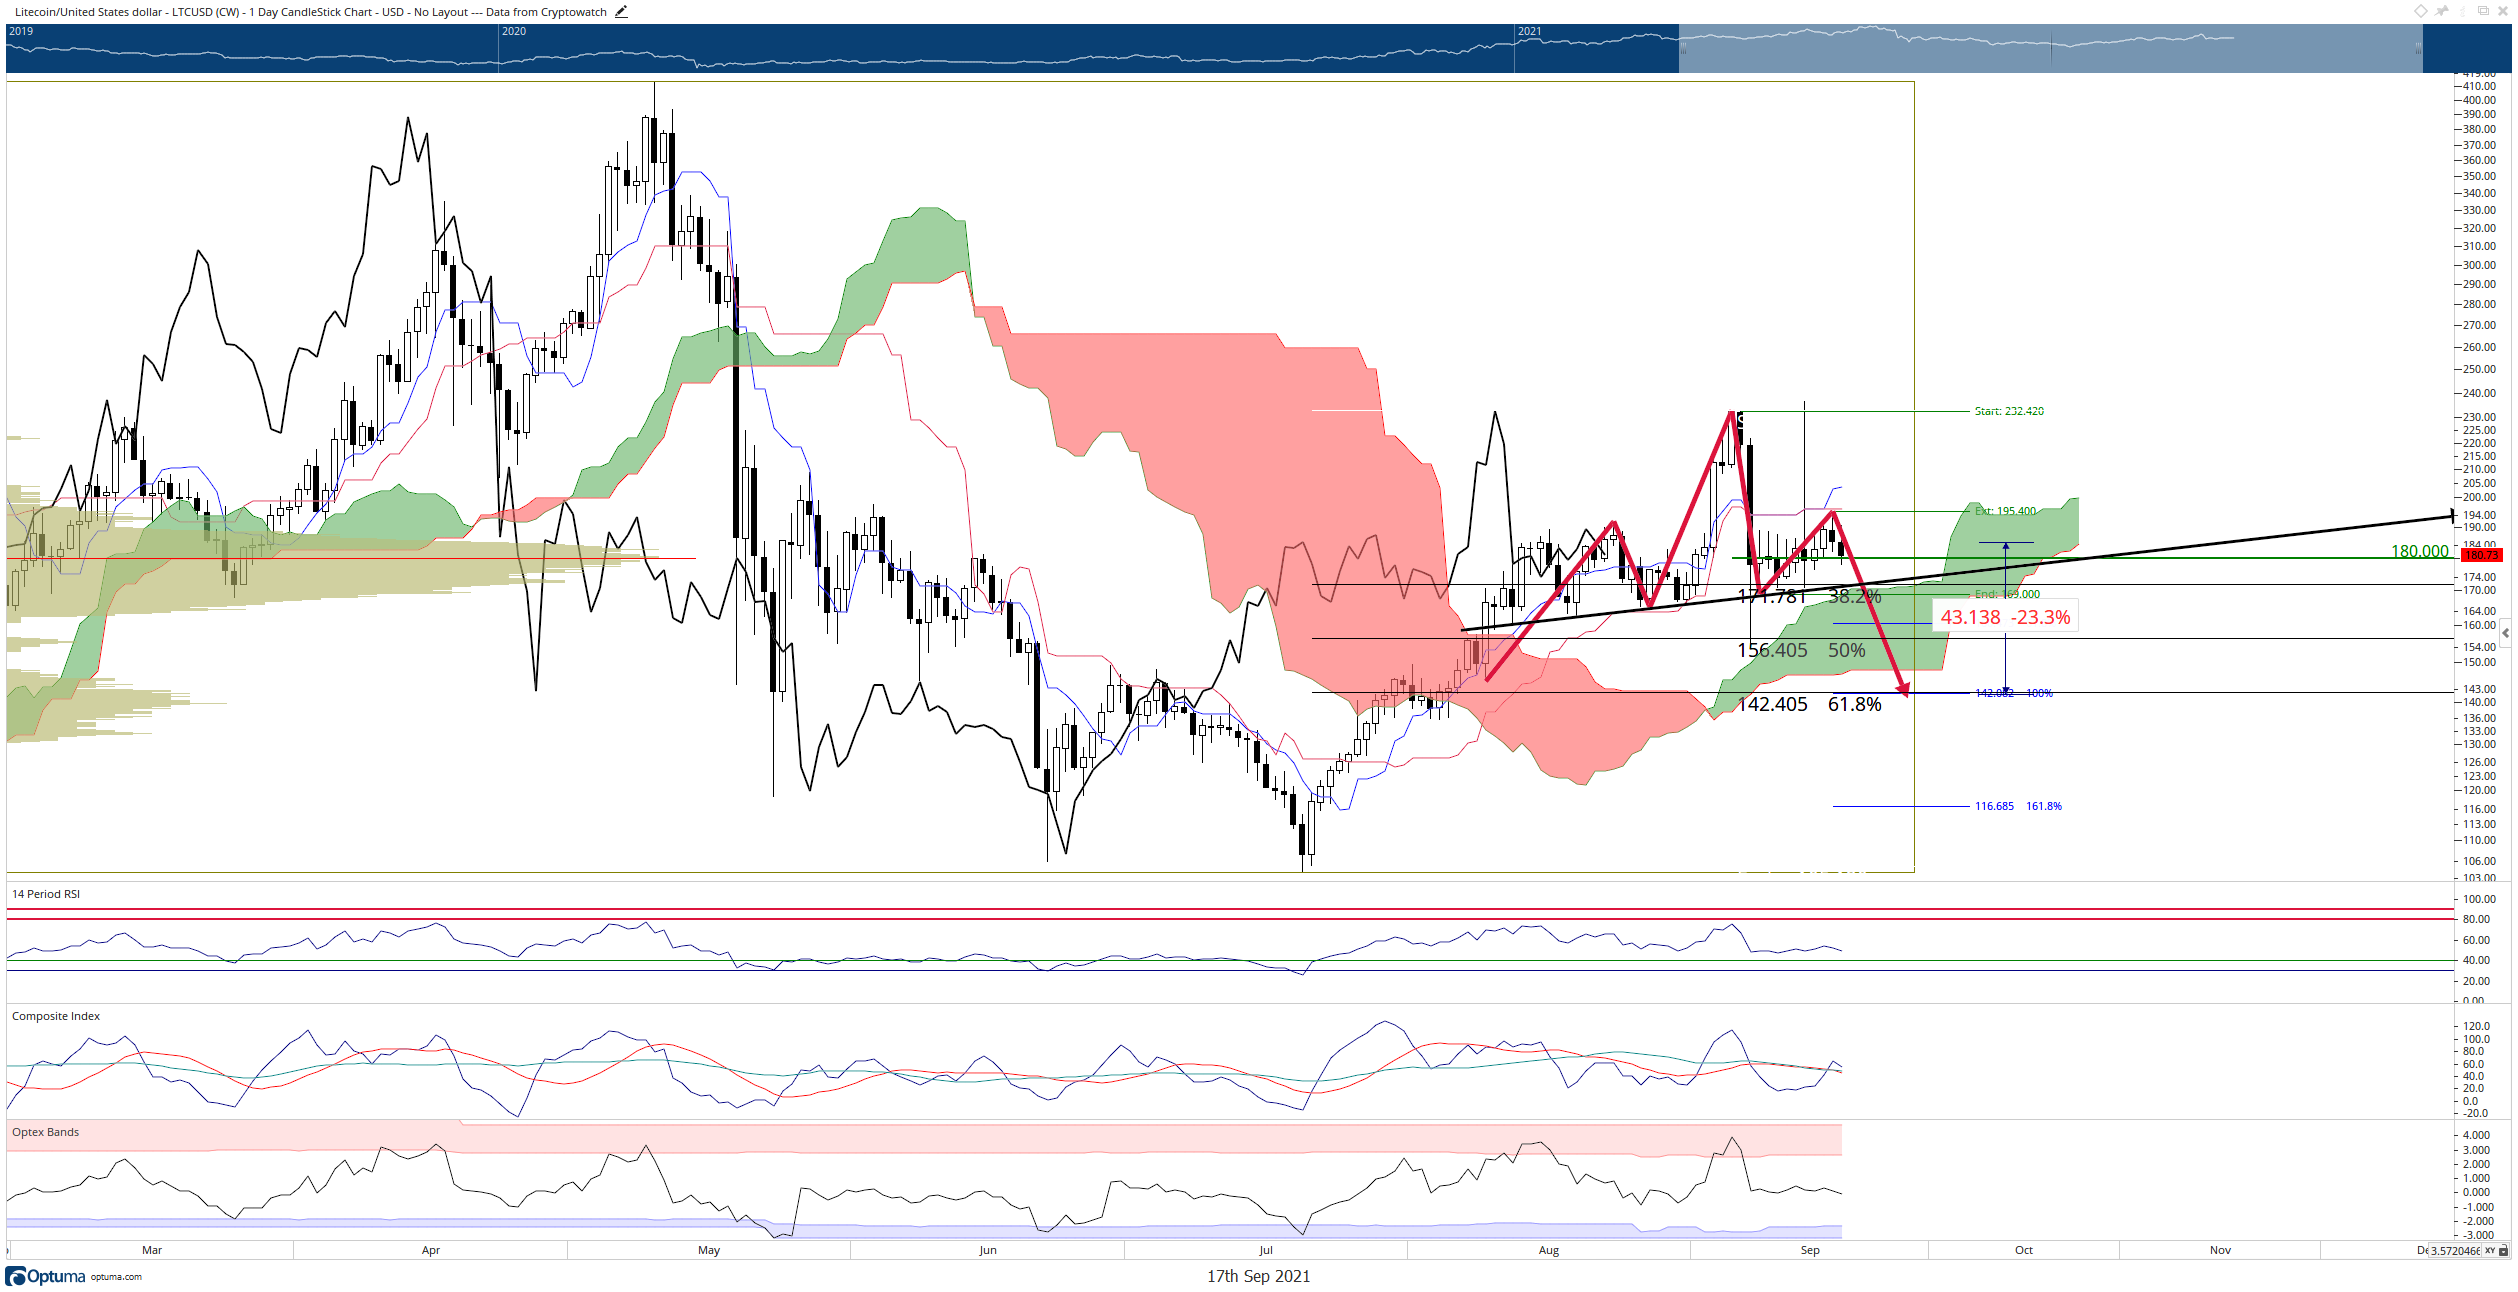
Litecoin price has not done very well since the false report on Walmart accepting Litecoin news came out on Monday. Despite the fake news, many bulls and bears thought there might have been some strong follow-through higher, but the past two trading sessions have resulted in lower closes and the development of a very bearish reversal pattern: the head-and-shoulders pattern.
Litecoin bulls possibly led to slaughter, -23% drop from the Friday open in play
Litecoin price faces increasing selling pressure if it can’t maintain the $180 value area. $180 is vital to Litecoin because it represents the 2021 VPOC (Volume Point-Of-Control) in the Market Profile indicator. The Market Profile measures volume horizontally rather than vertically. Traditional volume measurements commonly seen below candlesticks measure the amount of something traded during a particular time, but Market Profile measures how much was traded at a particular price. In other words, $180 is where the most amount of trading of Litecoin has occurred in 2021. It’s a powerful support and resistance level, and it is that level that bulls are attempting to defend.
LTC/USD Daily Ichimoku Chart
Below $180, the volume profile thins out, and it is easier for Litecoin to move lower than to move higher. Drawing a Fibonacci expansion from the September 5th high to the September 8th swing low shows the 100% expansion level at $142.40. That is right on top of the 61.8% Fibonacci retracement level, which has the same value. Within the volume profile, $140 is the top of a high volume node, adding strength to the support of the two Fibonacci levels.
The bearish outlook will be invalidated if three conditions are met. First, the daily must close above the Tenkan-Sen and Kijun-Sen –around the $204 value area. Second, the Lagging Span needs to trade above the candlesticks – in the $200 value area. Third, the Relative Strength Index needs to slope up and away from the level 50 zone.
Author

Jonathan Morgan
Independent Analyst
Jonathan has been working as an Independent future, forex, and cryptocurrency trader and analyst for 8 years. He also has been writing for the past 5 years.



