Kyber Network Price Forecast: KNC aims for $0.50 amid growing uncertainty
- Kyber Network bearish case has been confirmed by the H&S pattern in the 3-day range.
- The number of new addresses joining the network continues to fall as prices dip further down.

Kyber Network’s impressive rally met an untimely end at $2.00 on August 13. As bulls retreated into the sidelines to rejuvenate, sellers took over the cockpit controls, and since then, losses have been unstoppable as reported earlier. At the time of writing, KNC is trading at $0.9087 after the tentative support at $1.00 caved.
Kyber Network could plunge to $0.50
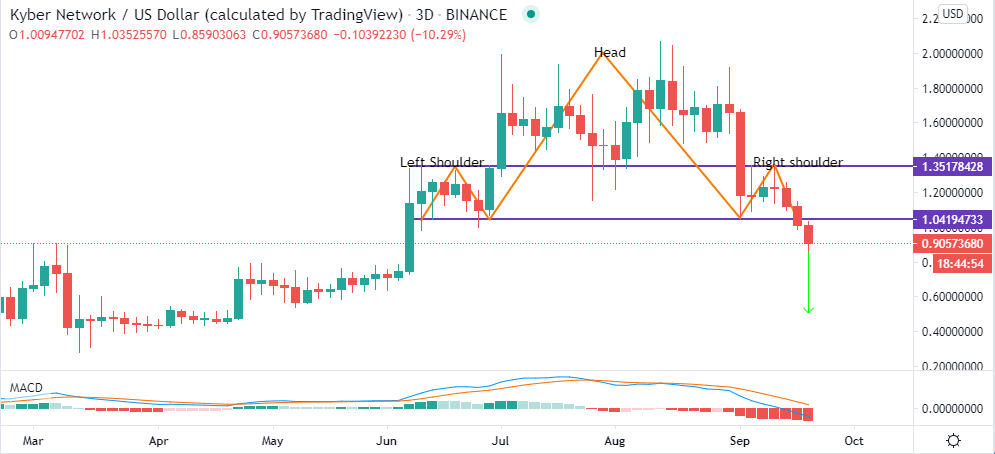
The 3-day chart has confirmed the formation of a head-and-shoulders (H&S) pattern, bringing into the picture a 50% correction to $0.50. The Moving Average Convergence Divergence (MACD) emphasizes the increase in selling pressure. In addition to resuming the negative region's downtrend, a bearish divergence under the MACD spells doom for KNC in the near term.
KNC/USD 3-day chart
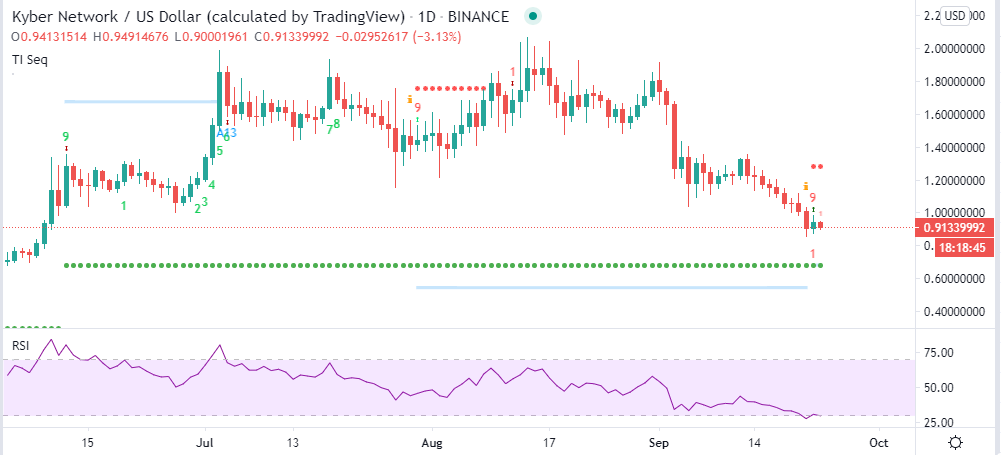
On the daily chart, a buy signal presented by the TD Sequential Indicator on September 22 has been invalidated by the H&S pattern's conformation. Besides, the Relative Strength Index (RSI) has aborted a recovery mission from the oversold region. In other words, bears continue to win the tug of war against the bulls. Therefore, the path of least resistance is likely to remain downwards in the near term.
KNC/USD daily chart
IntoTheBlock’s IOMAP model exposes the strong resistance ahead of KNC. The supply zone between $0.94 and $1.01 is in line to prevent the crypto from making strides upwards. More than 1,800 addresses previously purchased 5.59 million KNC in the range.
On the flip side, the only viable support lies in the region between $0.8085 and $0.8759. Here, 515 addresses bought 1.37 million KNC. If this demand zone is penetrated, KNC could fall towards $0.50, as seen in the technical analysis.
KNC IOMAP chart
-637364406119129026.png)
Consequently, IntoTheBlock’s “Daily Active Addresses” model reveals that the number of new addresses created on the network has been falling since September 1. About 850 new addresses joined the network at the beginning of September. This number has fallen gradually to 370, representing a 56% decline. The downtrend in the network's growth is a red flag, even for the Kyber Network price. The absence of newly-created addresses harms the regular inflow and outflow of tokens within the network, calling for investors' attention.
KNC daily new addresses chart
-637364406934047535.png)
Looking at the other side of the picture
The gravitational bull on KNC is intense at the moment. However, it is worth mentioning that support at $0.85 (confirmed on September 21) could invalidate the bearish leg to $0.50. A reversal from this zone could also flip the resistance at the 50 Moving Average in the hourly range into support. Building on that support, KNC could shift the focus back to $1.00 while nurturing a recovery trend.
Author

John Isige
FXStreet
John Isige is a seasoned cryptocurrency journalist and markets analyst committed to delivering high-quality, actionable insights tailored to traders, investors, and crypto enthusiasts. He enjoys deep dives into emerging Web3 tren


