Kyber Network Price Prediction: KNC could be on the verge of a 50% correction
- KNC is currently trading at $1.13 after a massive crash on September 3.
- The digital asset struggles to recover, but a recent buy signal could be the spark that bulls need.

Kyber Network was trading as high as $2.04 on August 14 but plummeted to $1.04 just 22 days later, a 48% loss that clearly shows bears are in full control in the short and mid-terms.
KNC/USD 12-hour chart
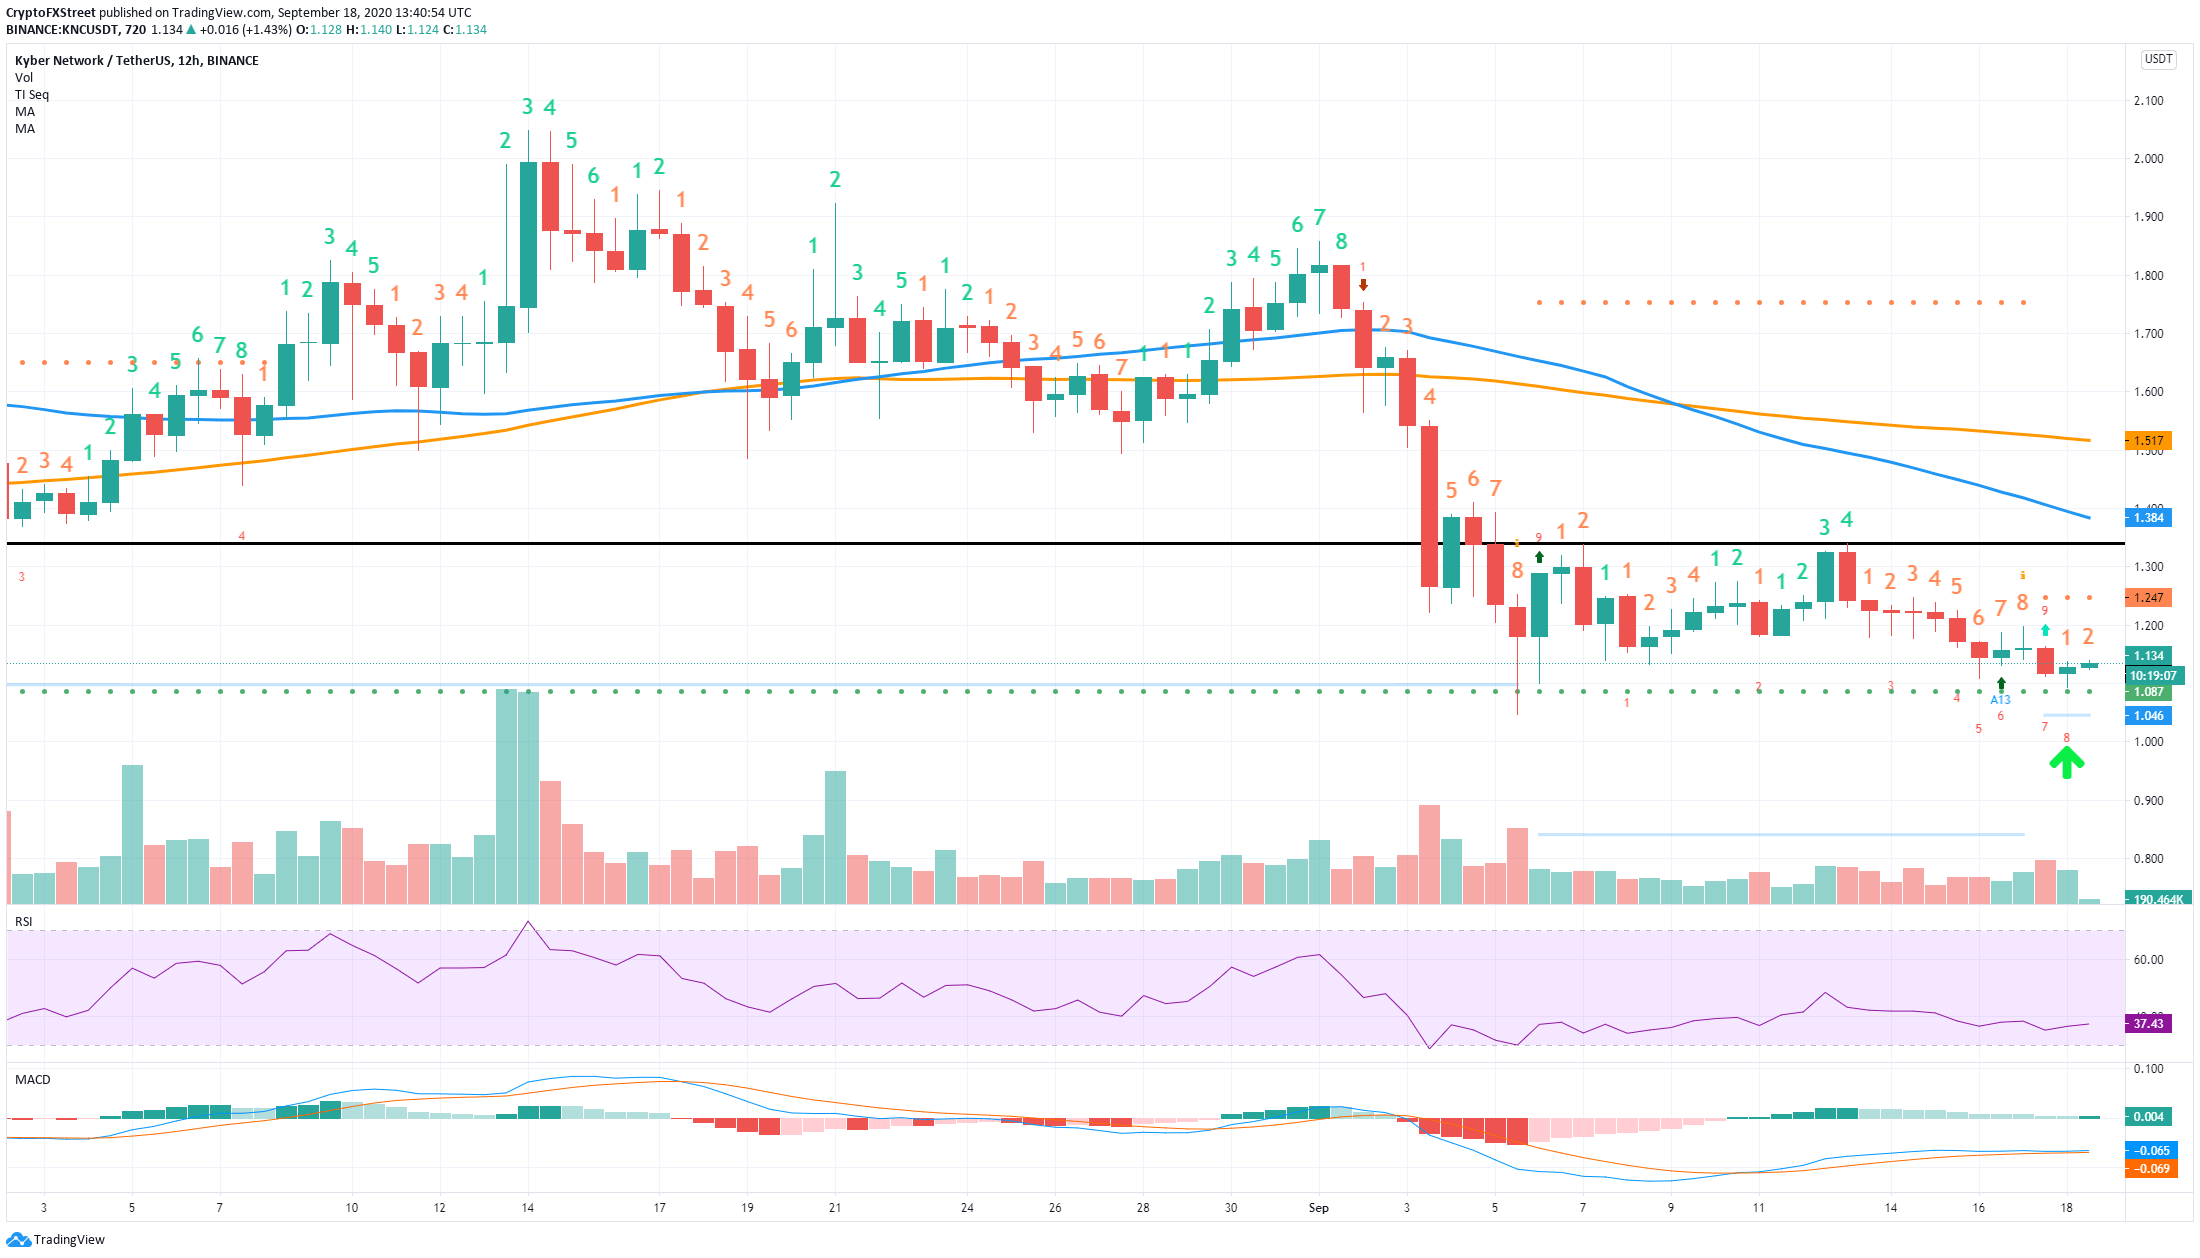
While almost everything is looking quite dull for KNC, a strong buy signal was created by the TD Sequential indicator on the 12-hour chart. The MACD was on the verge of a bearish cross; however, the recent price action seems to be holding it.
KNC Holders Distribution
 [15.37.07, 18 Sep, 2020]-637360339786456887.png)
Source: Santiment
The buy signal is robust, thanks to an increase in KNC holders. According to the Holders Distribution chart provided by Sanbase, the number of holders with 1,000 KNC coins or more has increased over the past few days. Most notable, holders with at least 1,000,000 KNC coins increased from 17 to 19.
KNC IOMAP Chart
Source: IntoTheBlock
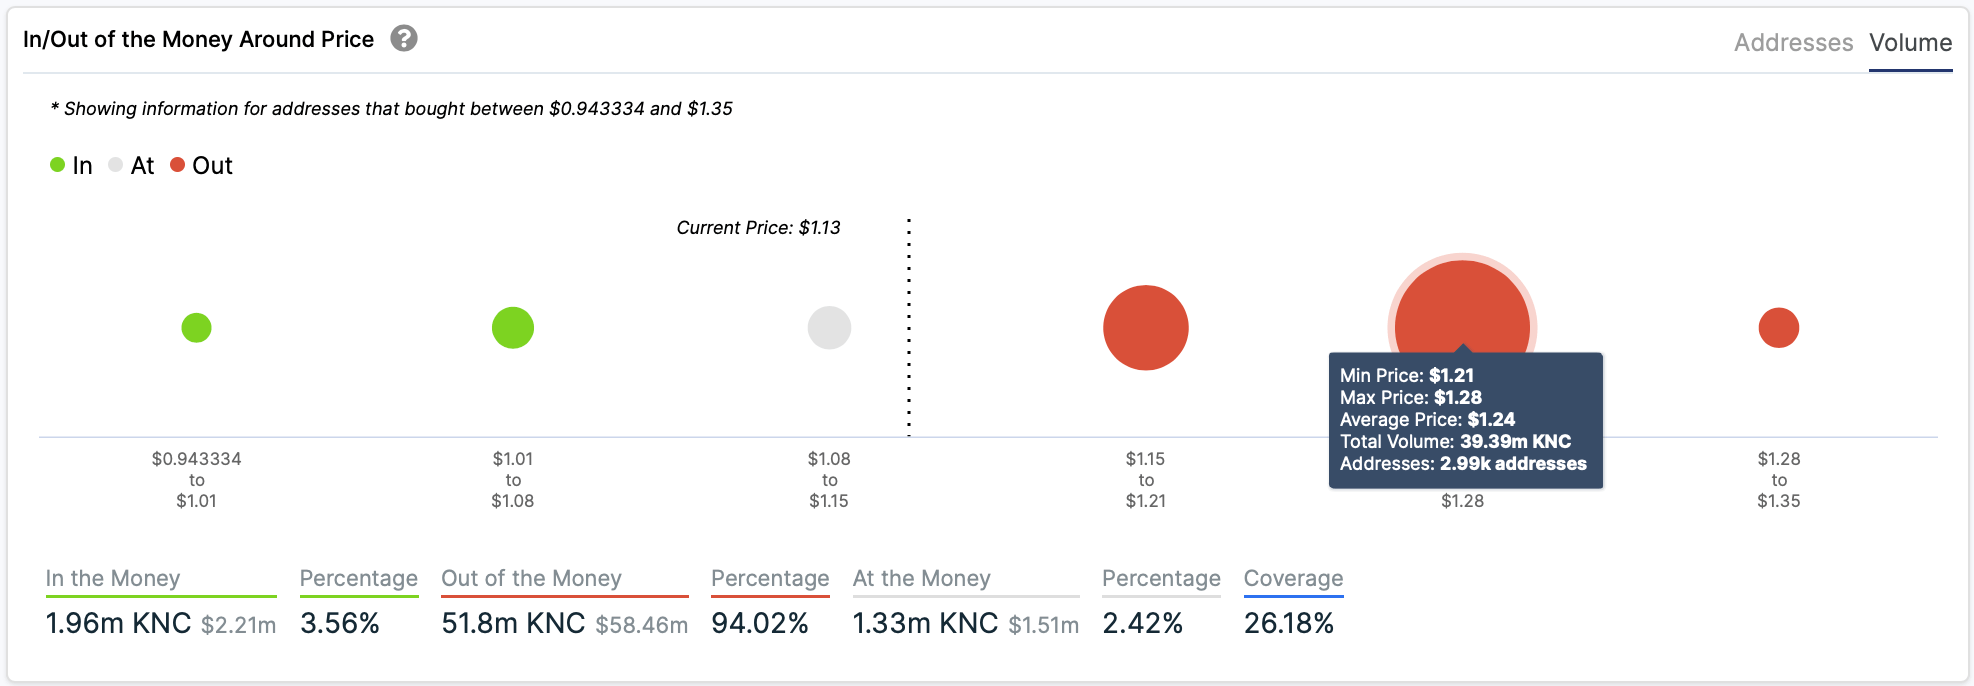
The next primary resistance cluster is found at $1.28, according to the IOMAP chart. It seems that beyond this point, there aren’t that many resistance levels. We can also see a resistance level in the form of a double top at $1.34, and then the 50-MA and 100-MAs will most likely act as resistance levels.
KNC/USD 12-hour chart bearish perspective
-637360340664694105.png)
On the flip side, it also seems that KNC has been forming a Head and Shoulders pattern. A clear breakout of the $1 neckline would be devastating for KNC, and it could push the digital asset as low as $0.50.
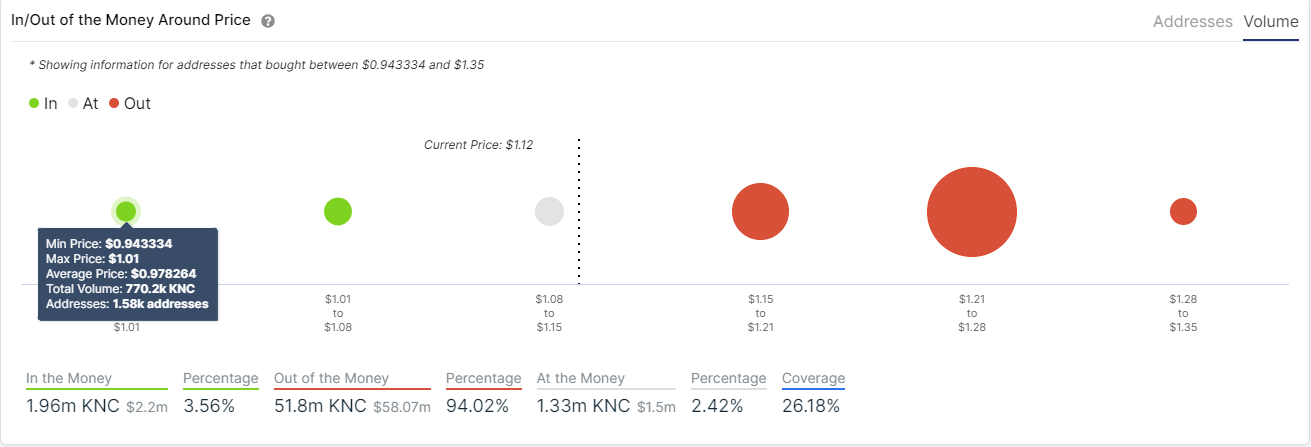
Looking at the previous IOMAP chart, the price of KNC is, in fact, at high risk of falling below $1 as there isn’t a lot of support, at least in comparison with the massive resistance above. Thus, investors must pay close attention to the $1 support and the $1.2 resistance level. Closing below or above this trading range will likely determine where Kyber Network's price is headed next.
Author

Lorenzo Stroe
Independent Analyst
Lorenzo is an experienced Technical Analyst and Content Writer who has been working in the cryptocurrency industry since 2012. He also has a passion for trading.




