Is this DeFi coin foreshadowing future performance of Ethereum price?
- Ethereum price has been consolidating between $1,677 and $1,600 for two weeks.
- A DeFi token showcases a similar price structure as ETH but has progressed further, hinting at an explosive move should a breakout occur.
- Invalidation of the bullish thesis will occur on the daily candlestick close below $1,505.

Ethereum (ETH) price has shown a clear rangebound movement for the past two weeks. While it has been interesting to trade the altcoin king, it has not particularly showered traders with volatility as it moves in lockstep with Bitcoin. However, things are looking ripe for a change, which could not only induce the volatility that has been amiss but also reintroduce the bullish momentum.
Also read: Everything you need to know about Ethereum’s Shanghai hard fork and why it matters
Ethereum price structure levels that matter
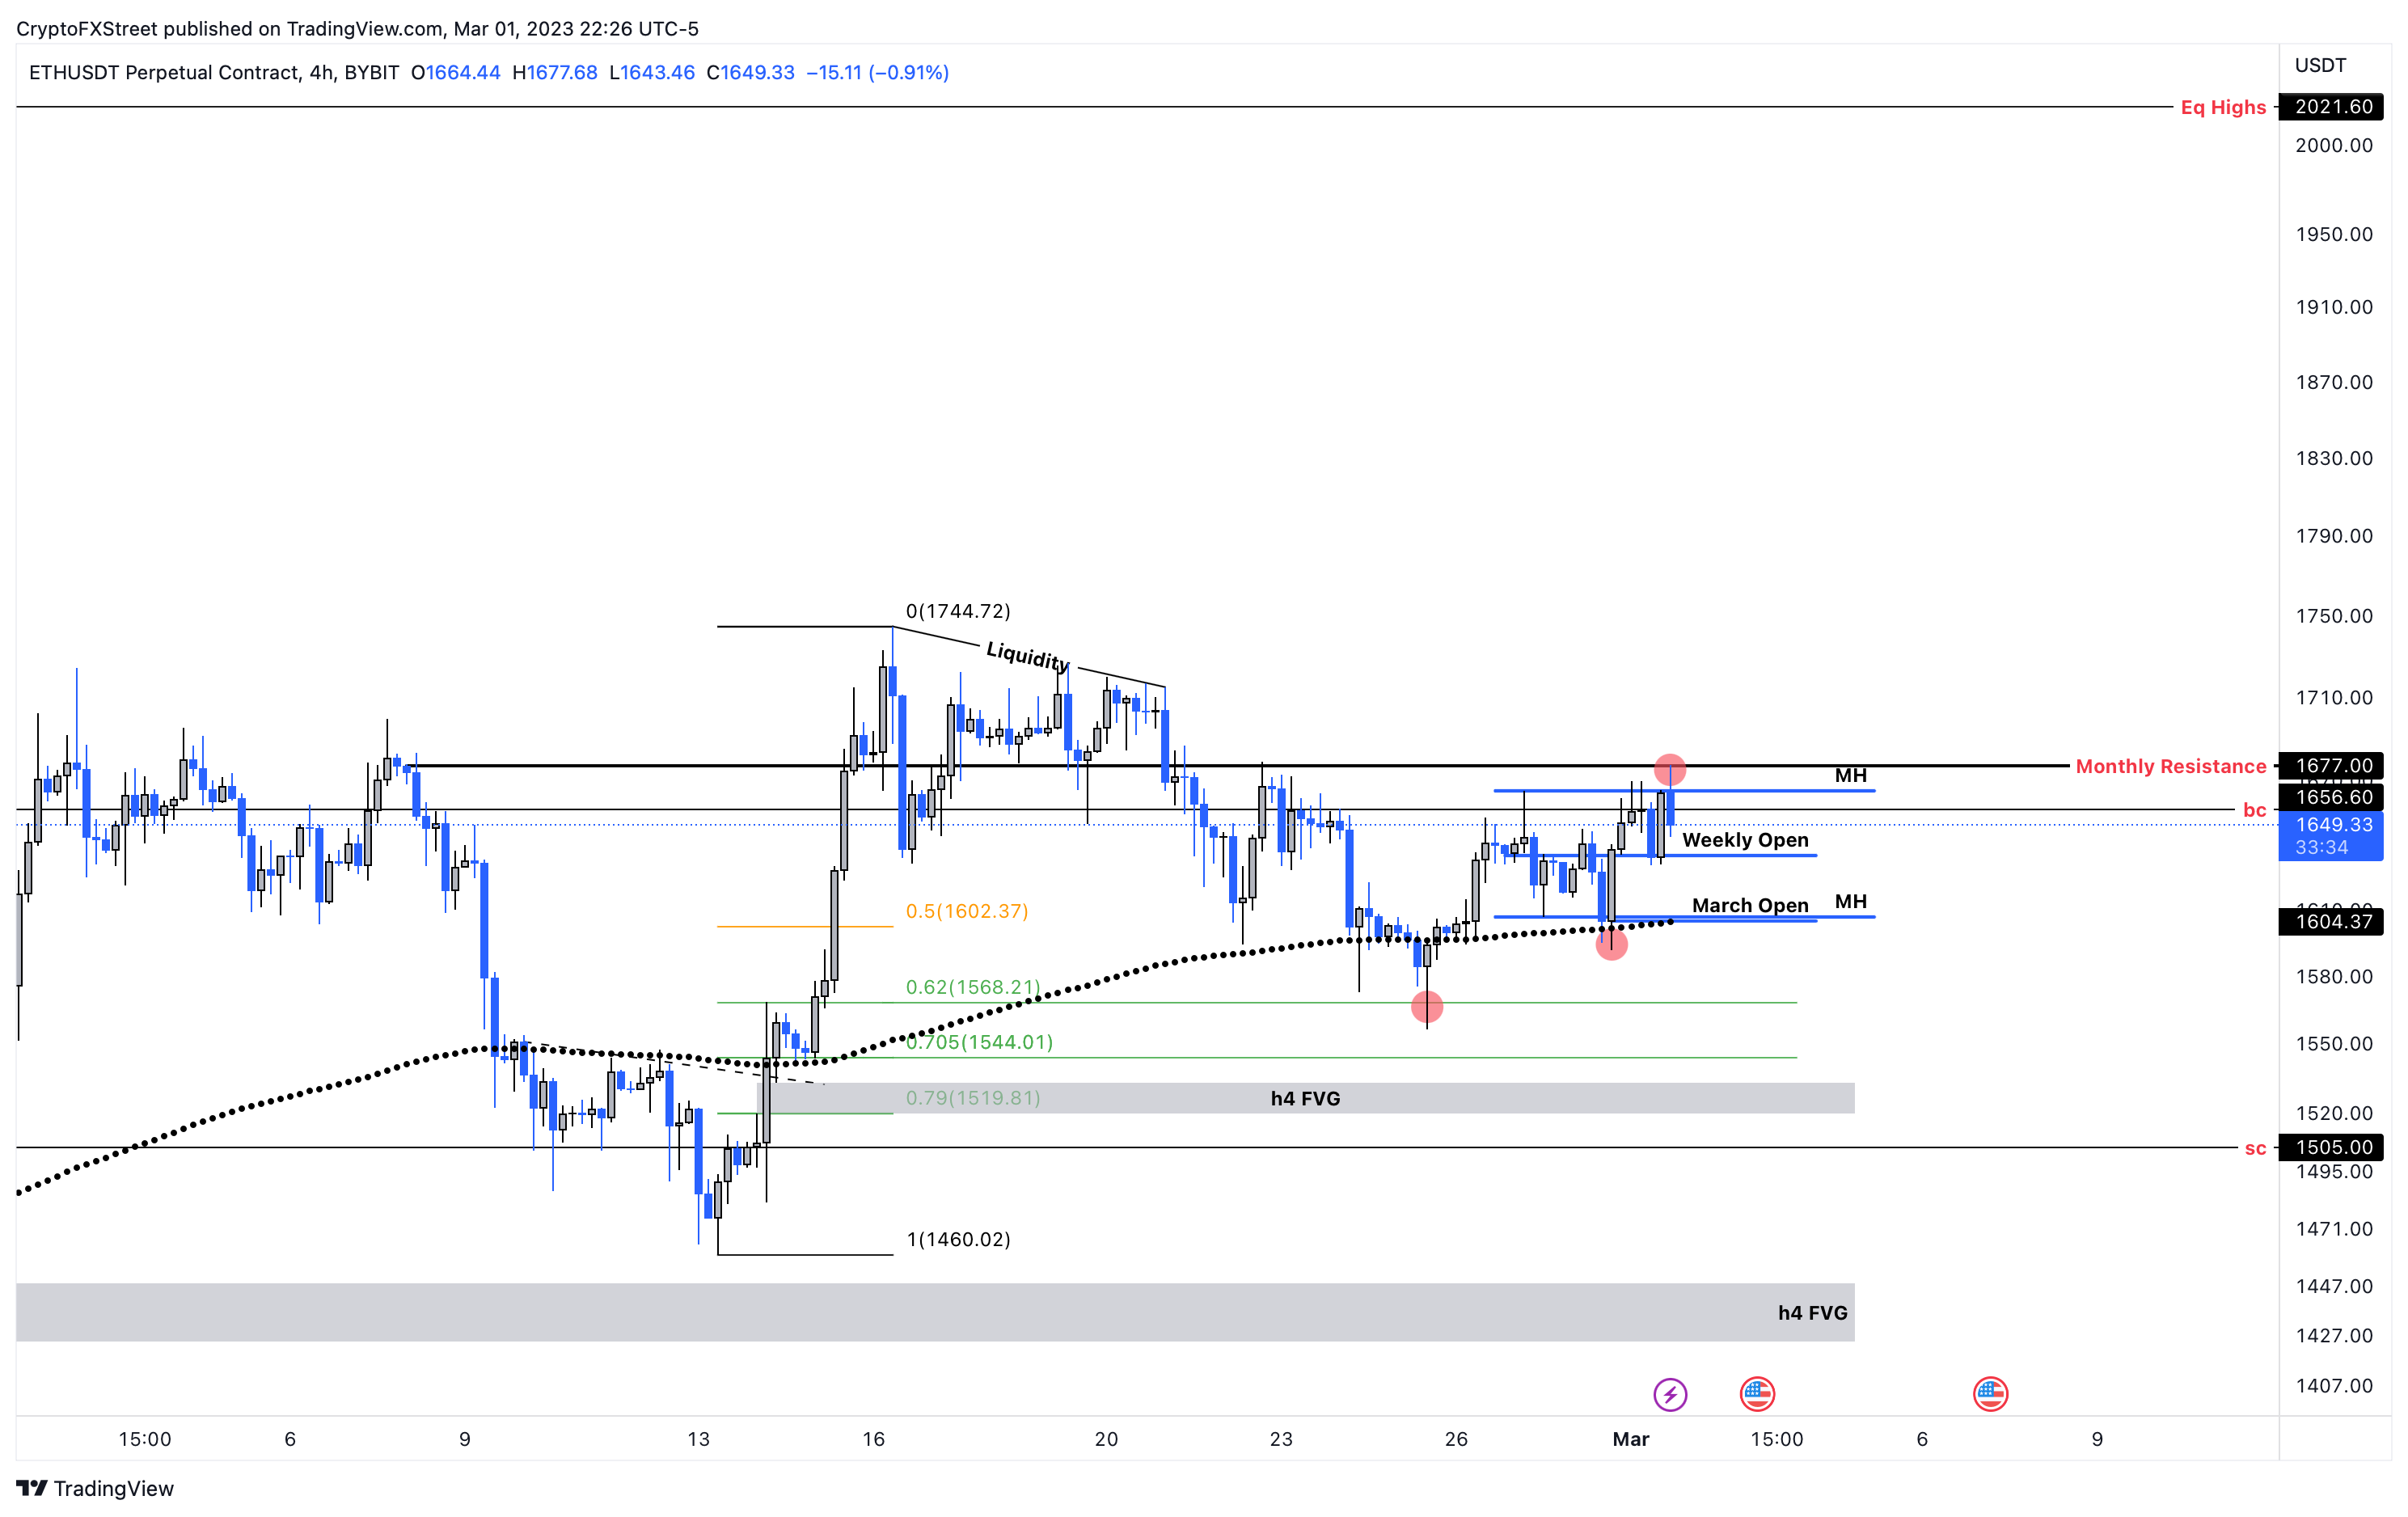
Etheruem price has collected the liquidity resting above/below Monday’s highs and lows. Since the weekly objective on both sides has been accomplished, investors need to be cautious and keep a close eye on the weekly and March’s open that are present at $1,635.11 and $1,604.75, respectively.
A bounce from either of these levels could be key in breaking above the monthly resistance level at $1,677. Once this level is breached, there is buy-stop liquidity resting above swing highs formed between February 16 and 21. Beyond this level, the momentum could easily push Ethereum price to $2,021.
In total, this move would constitute a 22% gain for market participants and is likely where the upside is capped for ETH.
ETH/USDT 1-day chart
DeFi token Synthetix Foreshadowing Ethereum’s moves
A popular analyst with a Twitter screenname of ColdBloodedShiller posted a chart talking about the similarities between a Decentralized Finance (DeFi) token, Synthetix (SNX), and Ethereum.
In this tweet, he showcases two important aspects of the SNX price that resembles what the Ethereum price is undergoing right now.
A tight consolidation that developed a bearish divergence resulted in a 5% pullback over three days. This correction was soon followed by an upthrust in buying pressure that propelled the SNX price by nearly 17% in the week.
Ethereum price shows a similar pattern, but it is still in the consolidation and bearish divergence development phase. Should the pullback be cauterized by premature buying and recovery, it would increase the odds of ETH following SNX’s path.
If history were to repeat, Ethereum price could inflate by 17%, which would put ETH at roughly $1,900.
$SNX providing a glimpse into the future for $ETH or simply an outlier for strength..? pic.twitter.com/4rwsgcB6pp
— Cold Blooded Shiller (@ColdBloodShill) March 2, 2023
Bear case for beloved smart contract token
While the upside outlook for Ethereum price seems logical and achievable, investors need to be cautious of a move to clear the inefficiency to the downside. The four-hour Fair Value Gap (FVG), extending from $1,519 to $1,533, is key. While a move to this area could occur, market participants should note that a breakdown of the selling climax at $1,505 on a daily timeframe will invalidate the bullish thesis for ETH. A flip of this level into a resistance barrier will likely tank Ethereum price to the next inefficiency, stretching from $1,448 to $1,424.
Author

Akash Girimath
FXStreet
Akash Girimath is a Mechanical Engineer interested in the chaos of the financial markets. Trying to make sense of this convoluted yet fascinating space, he switched his engineering job to become a crypto reporter and analyst.



