Top 3 Price Prediction Bitcoin, Ethereum, Ripple: March might not be as disappointing as February, here’s why
- Bitcoin price flashes a buy signal amid intense resistance levels in its path.
- Ethereum price suggests a potential rally to $1,800.
- Ripple price provides a bullish “if” for interested investors.

Bitcoin price shows a clear struggle with the immediate resistance levels. But this reliable indicator has flashed a buy signal that could trigger a rally, propelling Ethereum, Ripple and other altcoins with it. Hence, investors should be looking for a bullish start to March 2023.
Bitcoin price at crossroads
Bitcoin price shows a bullish market structure on a daily chart. But the pioneer crypto is stuck trending inside an ascending parallel channel, denoting a consolidation. So far, BTC has struggled to break through the midpoint of the said channel. But the development of a green ‘one’ buy signal from the Momentum Reversal Indicator (MRI) has increased the odds for bulls.
The last two times this indicator flashed a buy signal, BTC rallied 24% and 16%, respectively. So, if history were to repeat itself, Bitcoin price could kick-start another 7% to 26% upswing to $25,211 and $30,000, respectively.
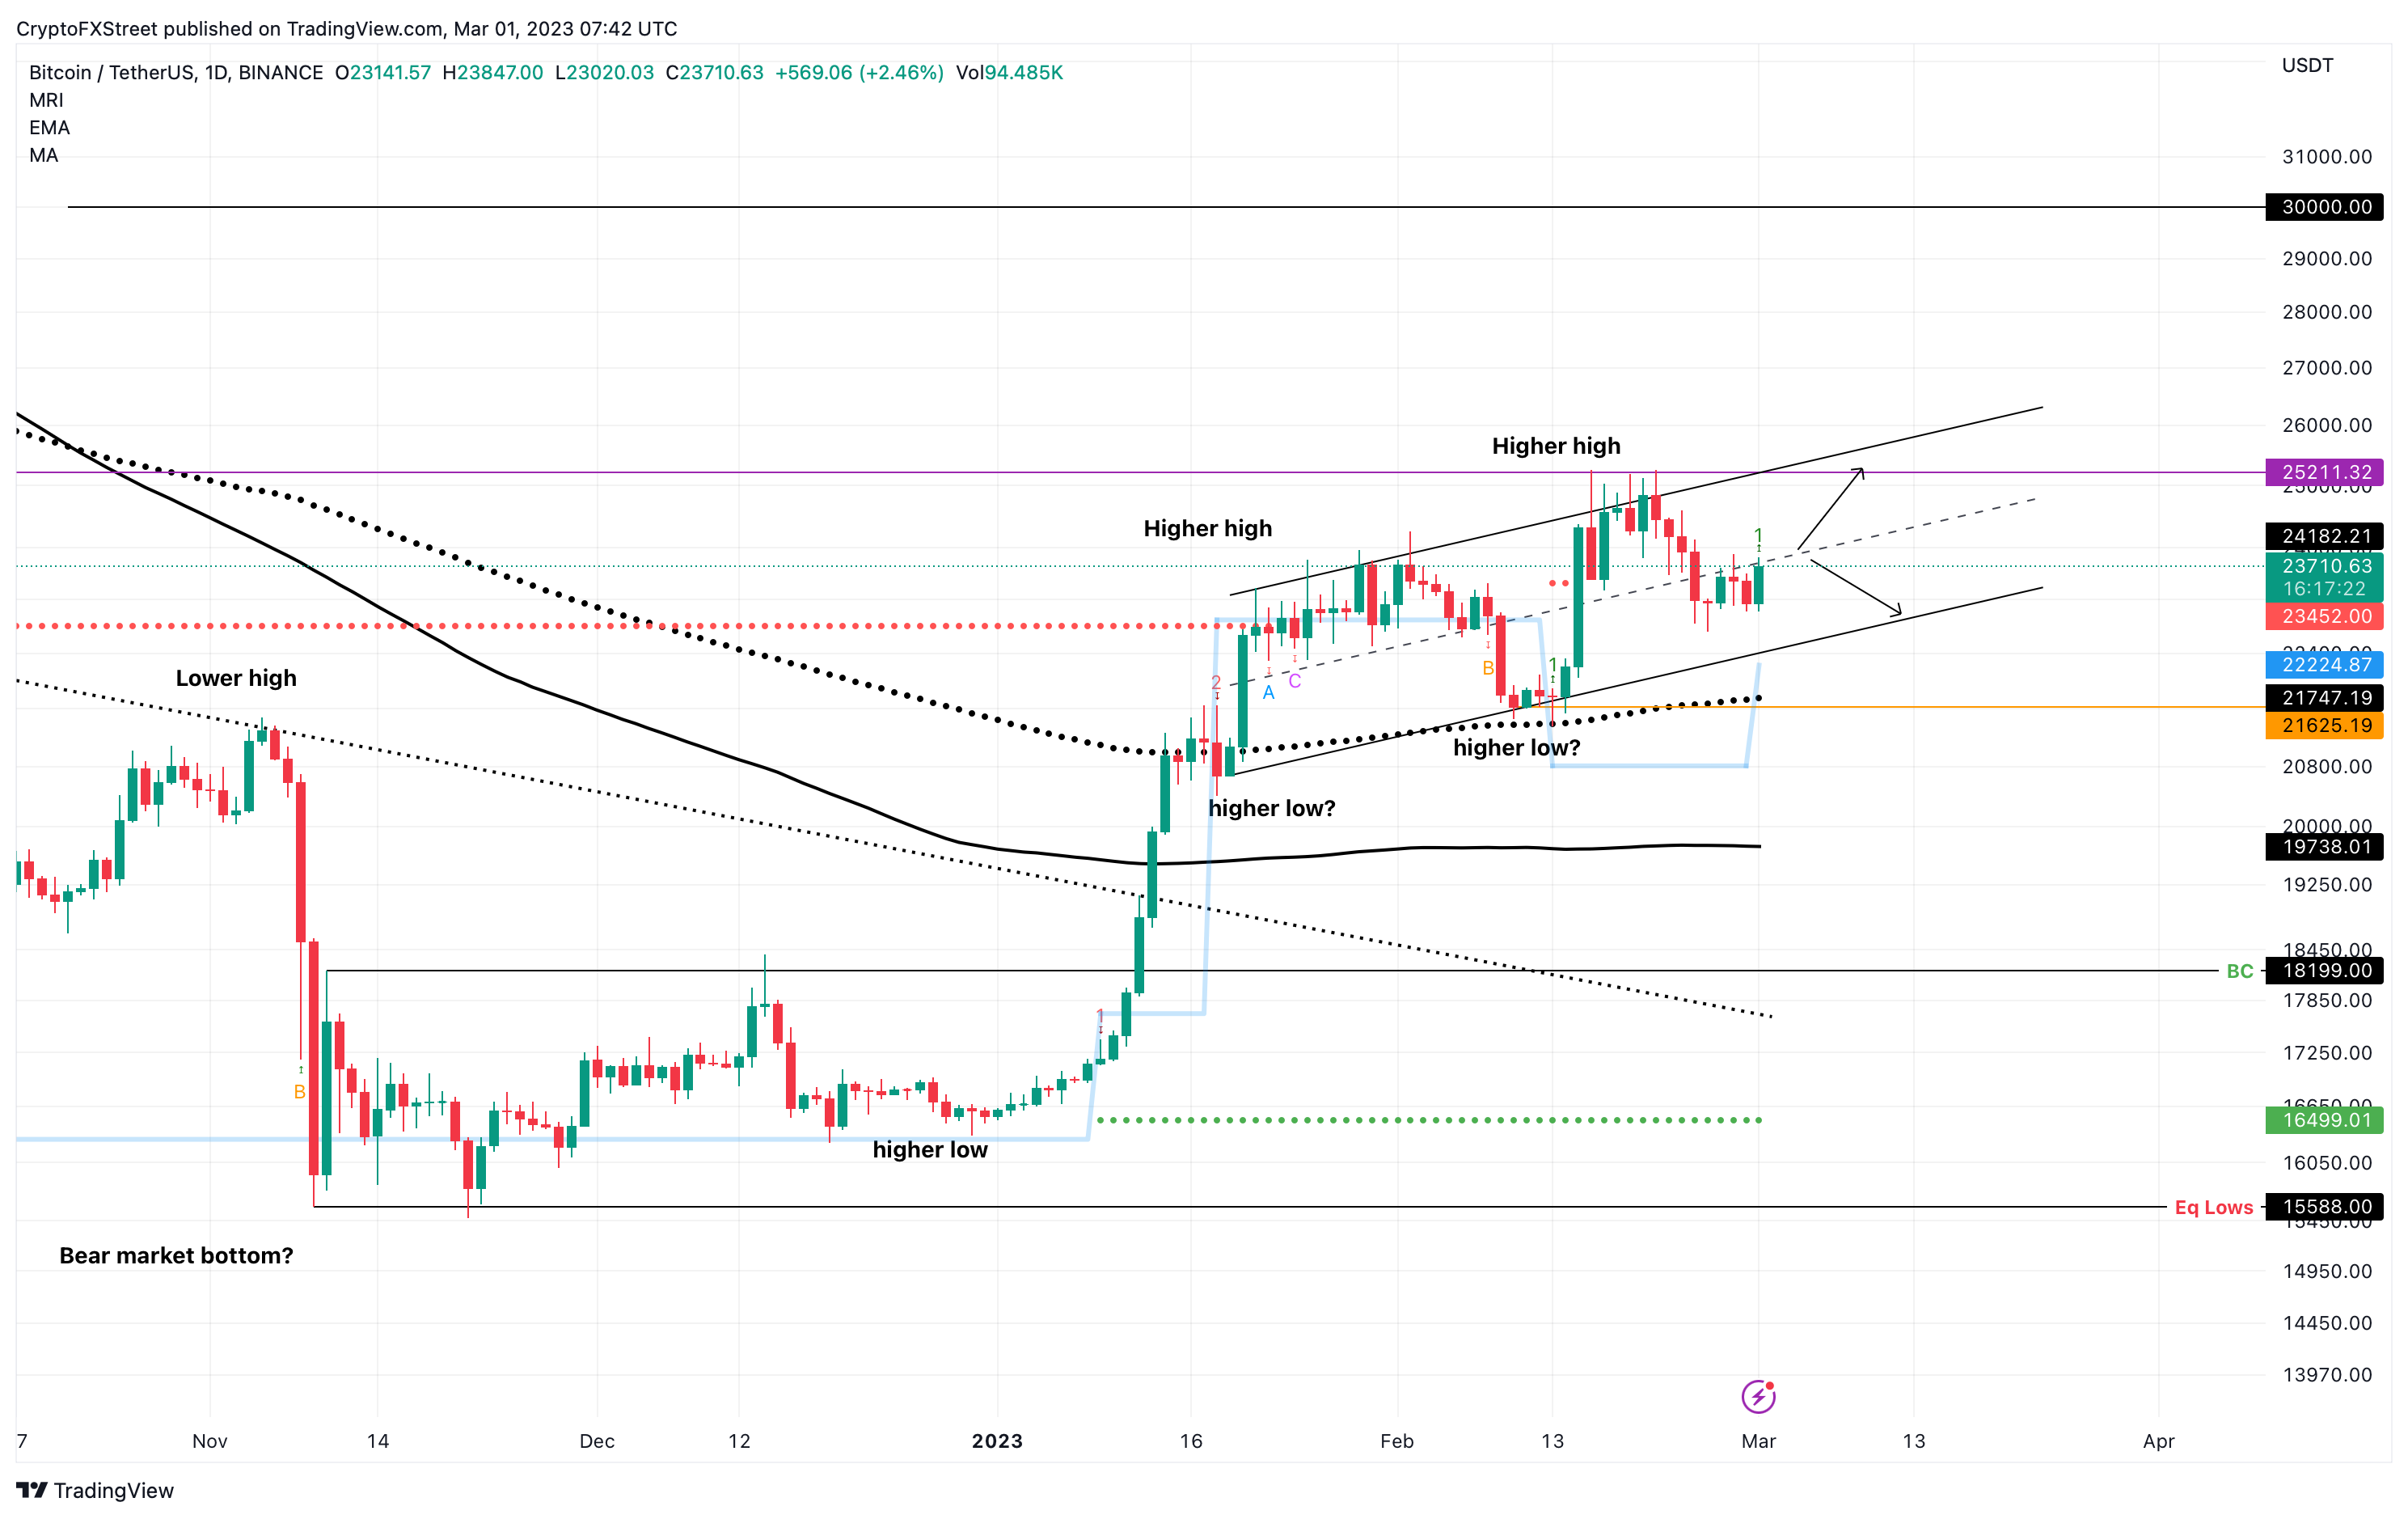
BTC/USD 1-day chart
While things are looking up for Bitcoin price, investors need to be aware of rejection at the ascending parallel channel’s midpoint. A decisive breakdown of the channel’s lower trend line followed by a flip of the $21,265 level would invalidate the bullish thesis. This move could potentially trigger a crash to $18,747.
Ethereum price ready to get ahead of the market
Ethereum price formed a triple tap setup, which is a bullish pattern containing three distinctive swing lows. The first swing low is where the exhaustion of the selling pressure occurs, following which there is a manipulative move that deviates below the selling climax and recovers. The last leg contains a retest of the first swing low.
A bullish move is forecast after the third retest of the triple tap setup, with upside expected to tag the immediate liquidity pool. In this case, there is little buy-side liquidity resting around $1,680. But the best place to book profits would be the range’s midpoint at $1,687, coinciding with the fair value gap.
Depending on the buying pressure and general market structure, Ethereum price could extend as high as $1,744 to collect the buy-stop liquidity shown in the chart below.
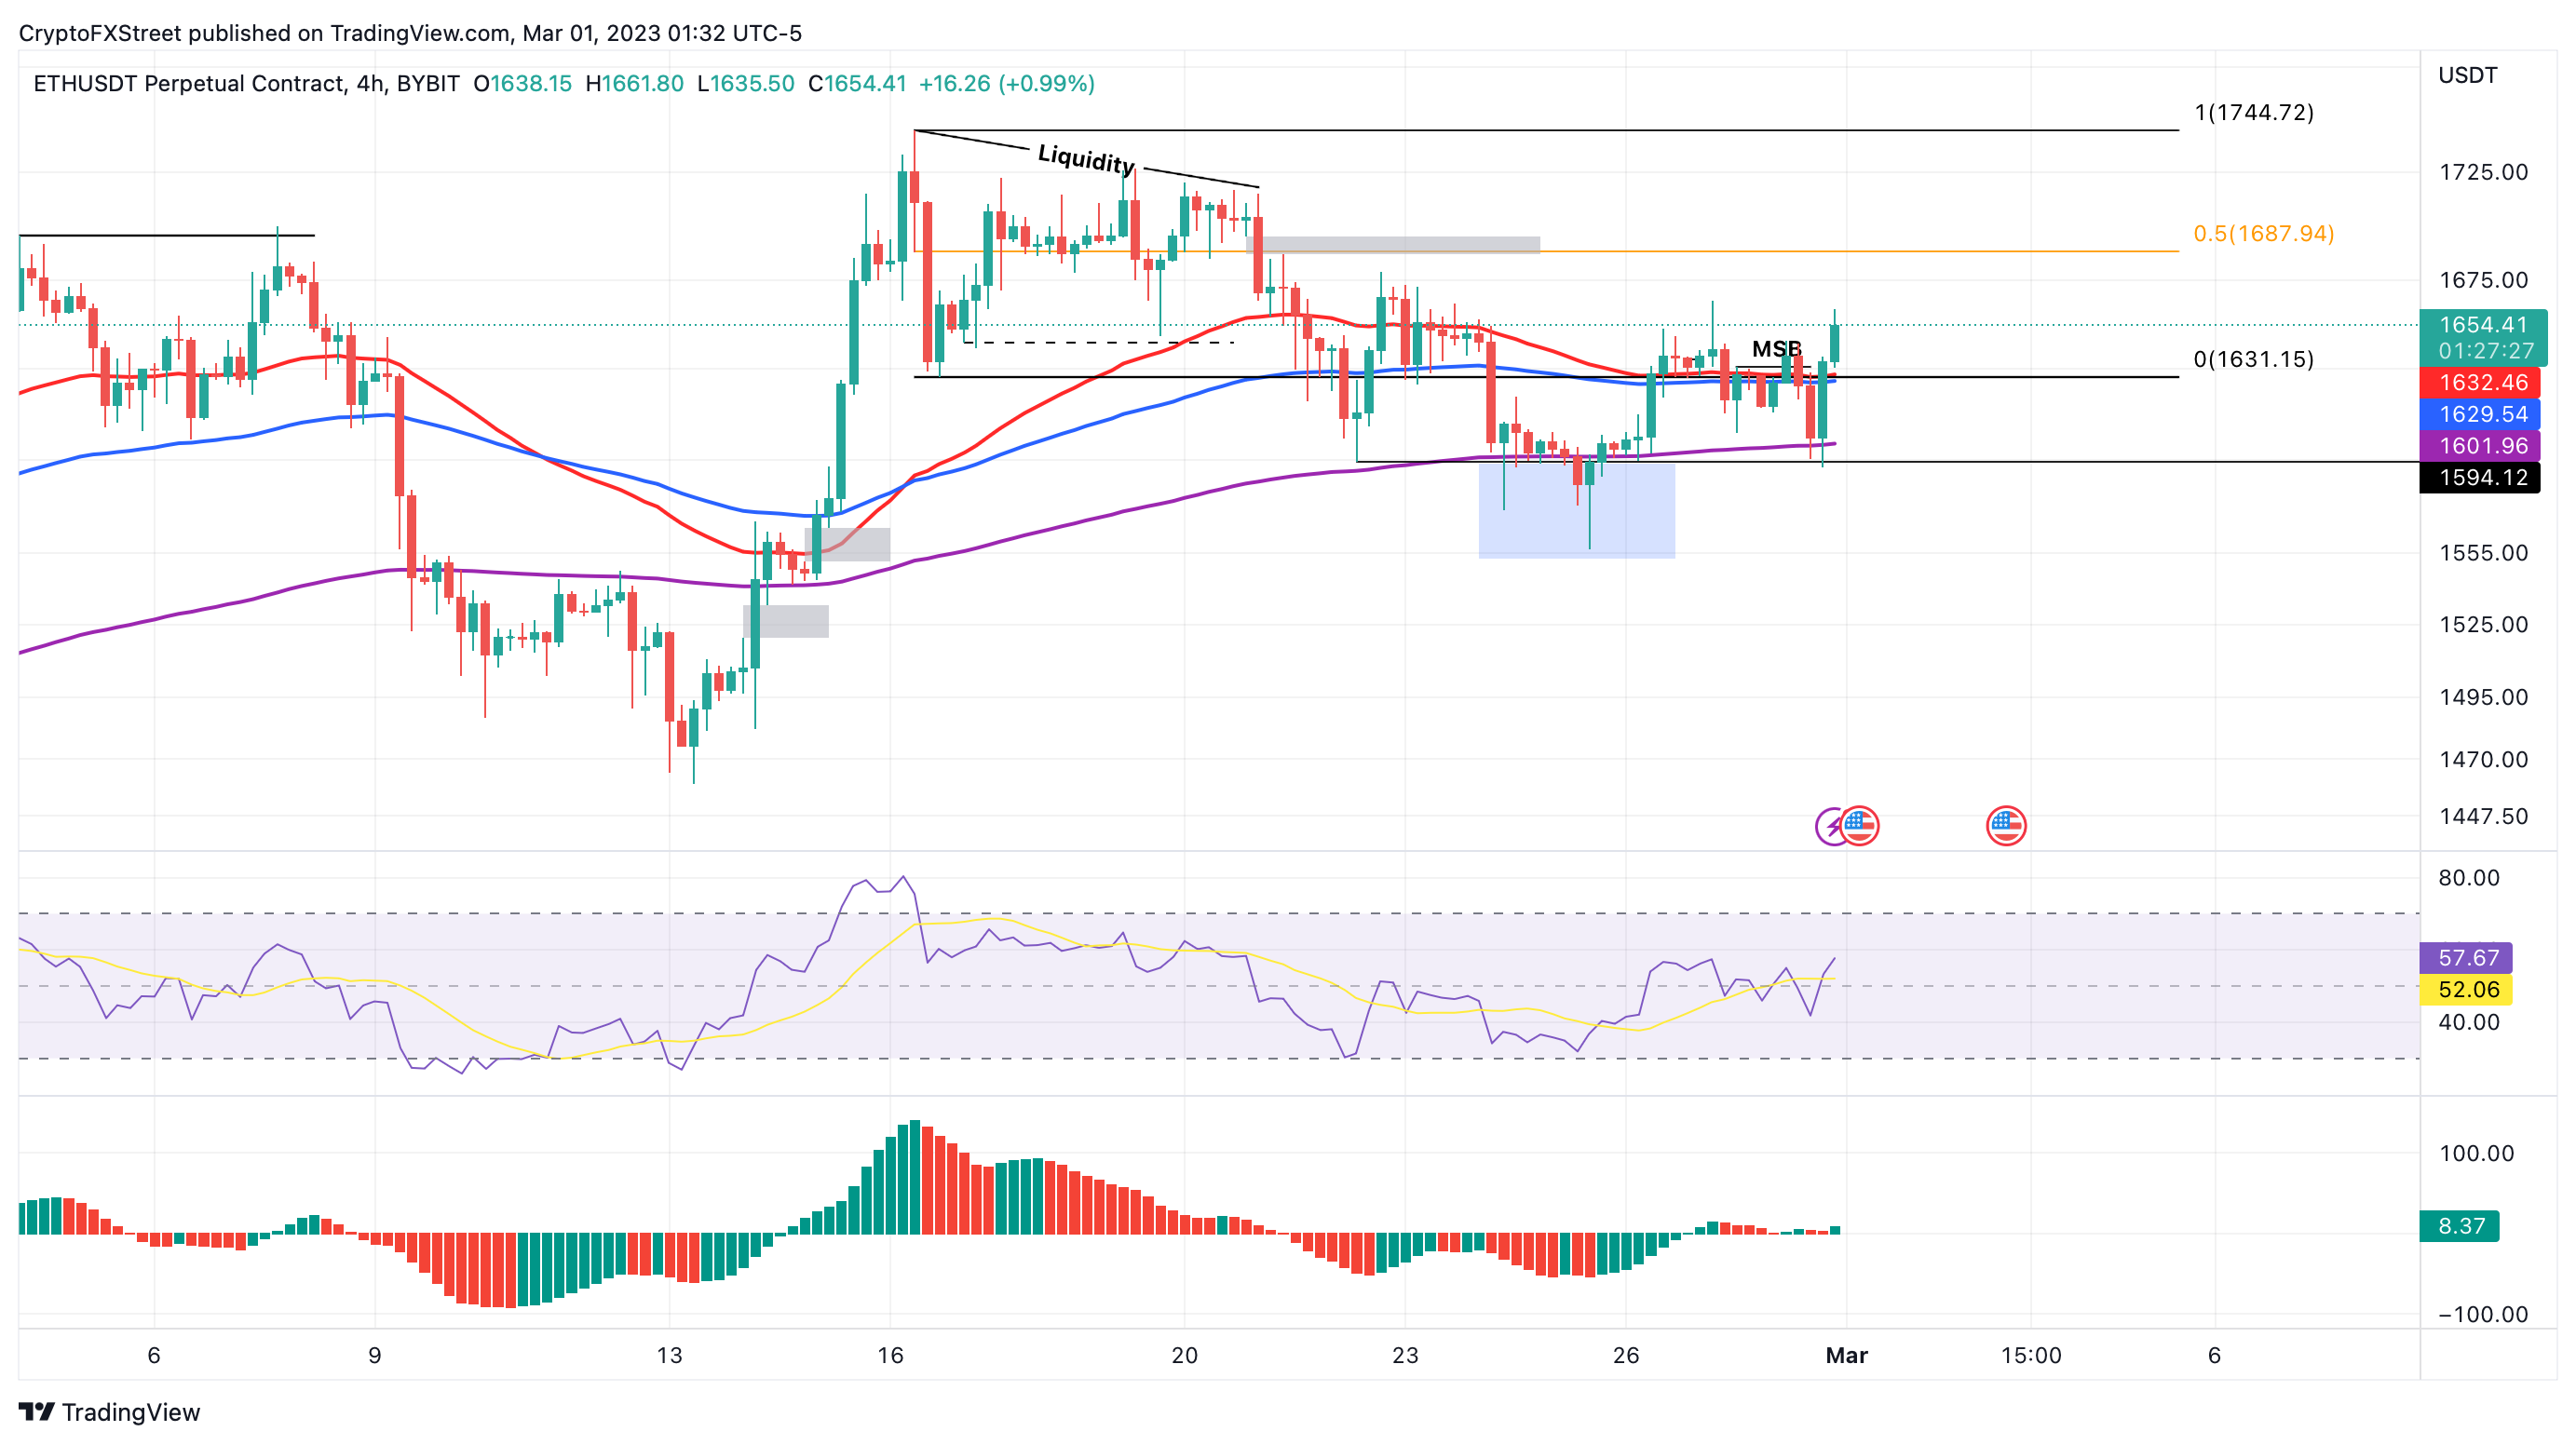
ETH/USD 4-hour chart
On the other hand, if the $1,687 level rejects Ethereum and triggers a reversal, investors need to exercise caution. In such a case, if ETH flips the $1,594 hurdle into a resistance level, it will invalidate the bullish thesis and trigger a potential crash to $1,533.
Ripple price hints at a bullish outlook
Ripple price shows a potential for an inverse head-and-shoulders setup. This bullish technical formation forecasts a 27% upswing to $0.558, obtained by adding the distance between the head’s lowest point and the neckline.
While the pattern is bullish, it is not yet confirmed as the right shoulder is yet to tag the neckline. After this move, Ripple price needs to produce a decisive close above the neckline at roughly $0.445.
After these two conditions are met, the inverse head-and-shoulders pattern will be confirmed, and the forecasted targets will come into play.
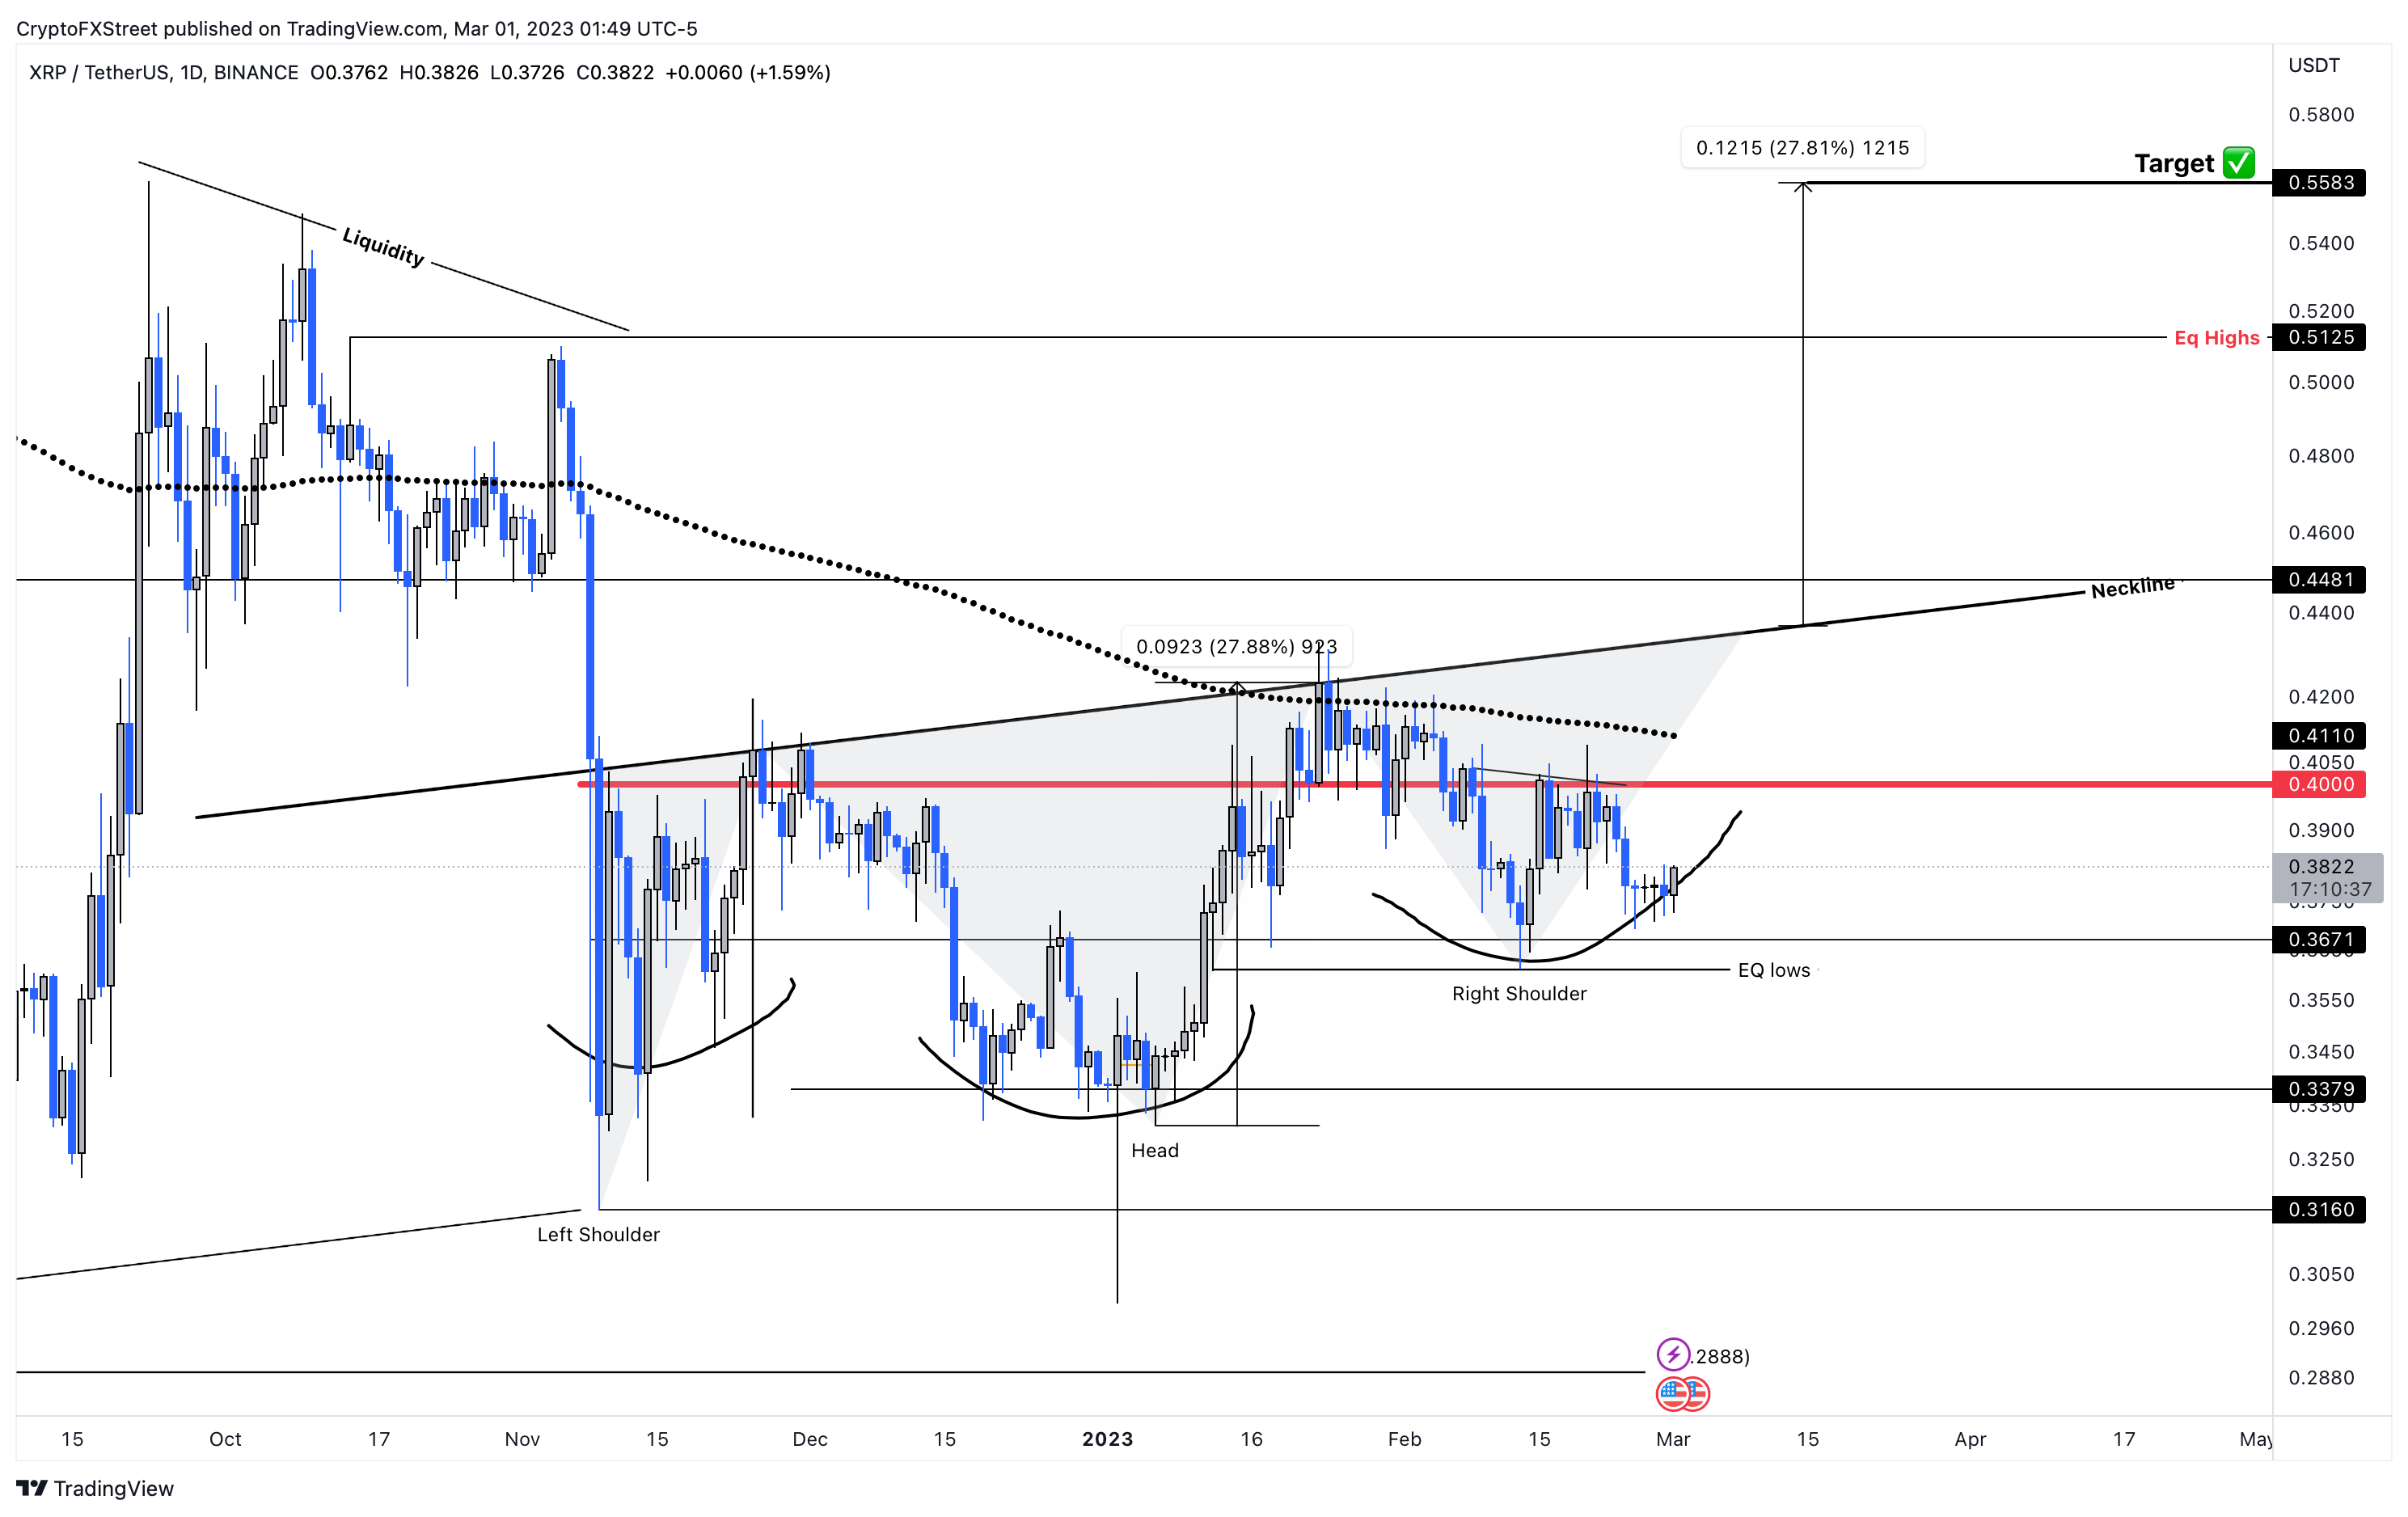
XRP/USD 1-day chart
Regardless of the potential bullish outlook, if Ripple price fails to climb higher and complete the right shoulder, it will all be pointless. Contrary to the mainstream idea, if XRP price produces a lower low below the $0.367 support level, it will invalidate the bullish idea and potentially trigger a sell-off to $0.337.
Author

Akash Girimath
FXStreet
Akash Girimath is a Mechanical Engineer interested in the chaos of the financial markets. Trying to make sense of this convoluted yet fascinating space, he switched his engineering job to become a crypto reporter and analyst.


