Is the uptrend in Cardano price sustainable?
- ADA price has an interesting volume pattern signaling smart money involvement.
- Cardano price has yet to print a bullish candle of equal value to the May 12 sell-off.
- Invalidation of the downtrend is a breach at $0.714.

Cardano price could merit questioning as the technicals have yet to issue a confident signal despite the considerable uptrend movement.
Cardano price is a tricky chart.
Cardano price could fool traders once again as the price action hints subtly at a future sell-off. Since May 12, the bulls have endured a brutal stranglehold by the bears. On May 15, the bulls tried to promote a rally, but the countertrend retaliation was short-lived. The bears immediately stepped back into the market, defending the bearish trend and wiping out nearly all net positive gains for bullish traders. On May 29, the bulls tried again and saw more success. Analyzing the tug of war price action, it appears the bulls could face exhaustion and may not be able to provide support for much longer.
Cardano price currently trades at $0.64, now 60% higher than the brief $0.40 lows seen on May 12. The volume pattern signals a very strong ramping pattern which usually forecasts a future decline when established in downtrends. The volume pattern is now tapering off as the price increases. If the technicals are correct, the countertrend rally currently on display may be part of wave-four price action, which could send the ADA price as low as $0.20 in the coming weeks.
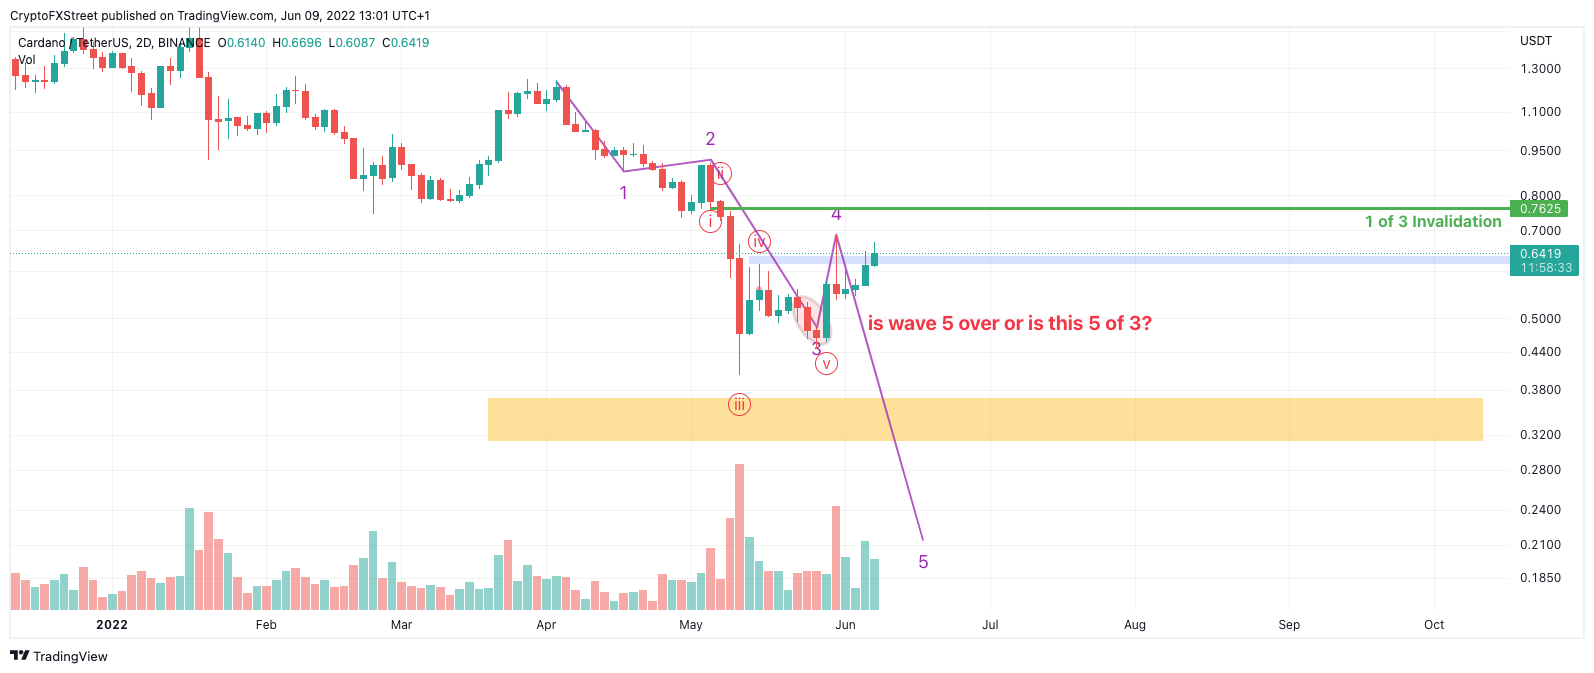
ADA/USDT 2-Day Chart
The Cardano price is a very tricky chart, and the downtrend has a high chance of being invalidated. The safest invalidation point is a breach above wave one at $0.77. If the invalidation level is breached, the downtrend can be deemed over. The bulls could rally as high as $1.25, resulting in a 95% increase from the current Cardano price level.
Author

Tony M.
FXStreet Contributor
Tony Montpeirous began investing in cryptocurrencies in 2017. His trading style incorporates Elliot Wave, Auction Market Theory, Fibonacci and price action as the cornerstone of his technical analysis.