|

Will Cardano price succumb and head to $0.20

  • ADA price is unfolding as an impulsive wave down.
  • Cardano price shows bearish divergence on the Relative Strength Index. 
  • Invalidation of the downtrend is a breach at $0.87.

Cardano price could be prepping for a fatal drop to $0.20.

Cardano price final capitulation low

Cardano price could be prepping for its final capitulation low. The technicals indicate an unfolding zig-zag that can extend as far as $0.20. Traders should be very cautious as the declining wave does hint at a 20% worth of countertrend space to potentially scalp upwards from the current price of $0.55. Still, scalpers in the market should be aware they are casting rods in treacherous waters as the slope of the decline indicates the current price within an extending and unfinished wave 3.

Cardano price can either sweep the lows as early as Monday morning or truncate within the vicinity of last week's low at $0.44 before more uptrend price action occurs. Still, traders should aim to maximize the potential reward while safely managing their risks. Before entering a short position, traders should consider waiting for the final 4th leg to print in the $0.65 zone. It is worth noting that the Relative Strength Index is displaying hidden bearish signals at time of writing which further confounds the idea of additional drops in the days to come.
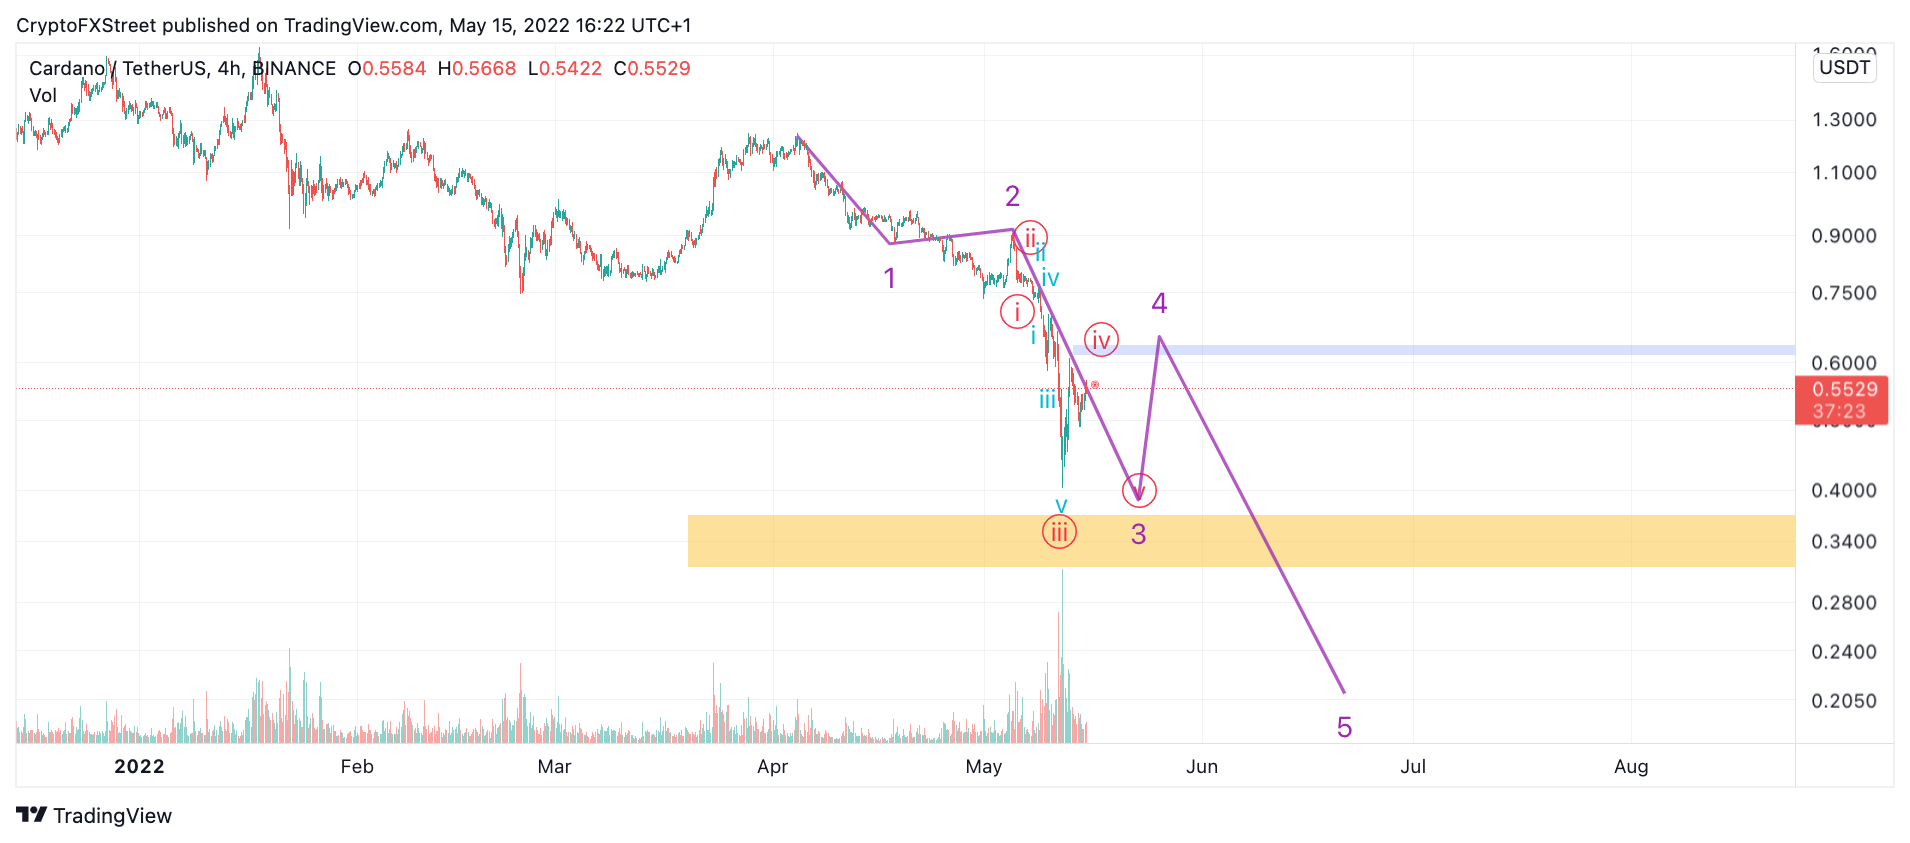
TM/ADA/5/15/22

ADA/USDT 4-Hour Chart

Invalidation for the downtrend is a breach at $0..87. If this level were to get touched, the downtrend would be void, and the bulls could then aim for $1.20, resulting in a 100% increase from the current Cardano price. 

Author

Tony M.

Tony M.

FXStreet Contributor

Tony Montpeirous began investing in cryptocurrencies in 2017. His trading style incorporates Elliot Wave, Auction Market Theory, Fibonacci and price action as the cornerstone of his technical analysis.


More from Tony M.
Share:

Editor's Picks

Top 3 Price Prediction: BTC, ETH, XRP under pressure as momentum indicators flag early bearish signals

Bitcoin, Ethereum, and Ripple remain under pressure on Wednesday, with technical indicators suggesting early weakening momentum across the top three cryptocurrencies following massive gains in August. BTC shows early bearish signals, while ETH has extended its pullback after rejection near $2,500. Meanwhile, XRP is consolidating below key support, keeping the outlook cautious.

Crypto Overview: US-Iran tensions weigh on Bitcoin – FIL, UNI lead gains

Bitcoin is trading below $77,000 on Wednesday, extending losses amid renewed risk-off sentiment, with the US and Iran trading new military strikes the previous day. Filecoin and Uniswap have emerged as top performers over the last 24 hours.

Bitcoin consolidates as spot activity cools, ETF demand remains key to rally

Bitcoin began September in a consolidation phase after seeing a sharp rally over the past two weeks. Despite the pullback, the broader market structure remains relatively healthy. In a Tuesday report, K33 noted that Bitcoin's average daily spot volume declined by 35% over the past week to $3.1 billion.

Ethereum Price Forecast: ETH gains over 30% in August, fueled by ETF inflows and whale accumulation
Ethereum (ETH) holds above $2,400 on Tuesday after recording a 32.5% gain in August, its best-performing month since July 2025. This marks two consecutive positive months for the top altcoin as it continues its recovery from a nearly 70% drop spanning October to June.
Bitcoin: Billions in ETF inflows push BTC toward decisive breakout
Bitcoin (BTC) extends gains so far this week, trading near $80,000 after testing the 50-week Simple Moving Average (SMA) at $81,114 earlier. Strong institutional demand is supporting the rally, with spot BTC Exchange Traded Funds (ETFs) on track to record a second consecutive week of billion-dollar inflows.


