Is Bitcoin price going to crash again?

Bitcoin (BTC $26,402) is still in a bullish reversal when looking at this year's price chart. BTC price has gained 70% after bottoming out at around $16,800 in November 2022, defying rate hike fears while riding on growing ETF approval optimism.
However, in recent months, Bitcoin bulls have failed to sustain BTC price above $30,000. Therefore, with the "bullish" halving is still over 200 days away, many traders are wondering: is Bitcoin price going to cash again in the coming months?
Let's take a closer look at the possible scenarios as Q3 draws to a close.
Fibonacci fractal hints at Bitcoin crash to $21,500
From a technical standpoint, Bitcoin price has stabilized around the 0.236 Fib line of its Fibonacci retracement graph drawn from the $69,000-swing high (the market top) to the $15,900-swing low (the local market bottom).
This flat BTC price action looks very similar to the one witnessed during the 2018 BTC price correction.
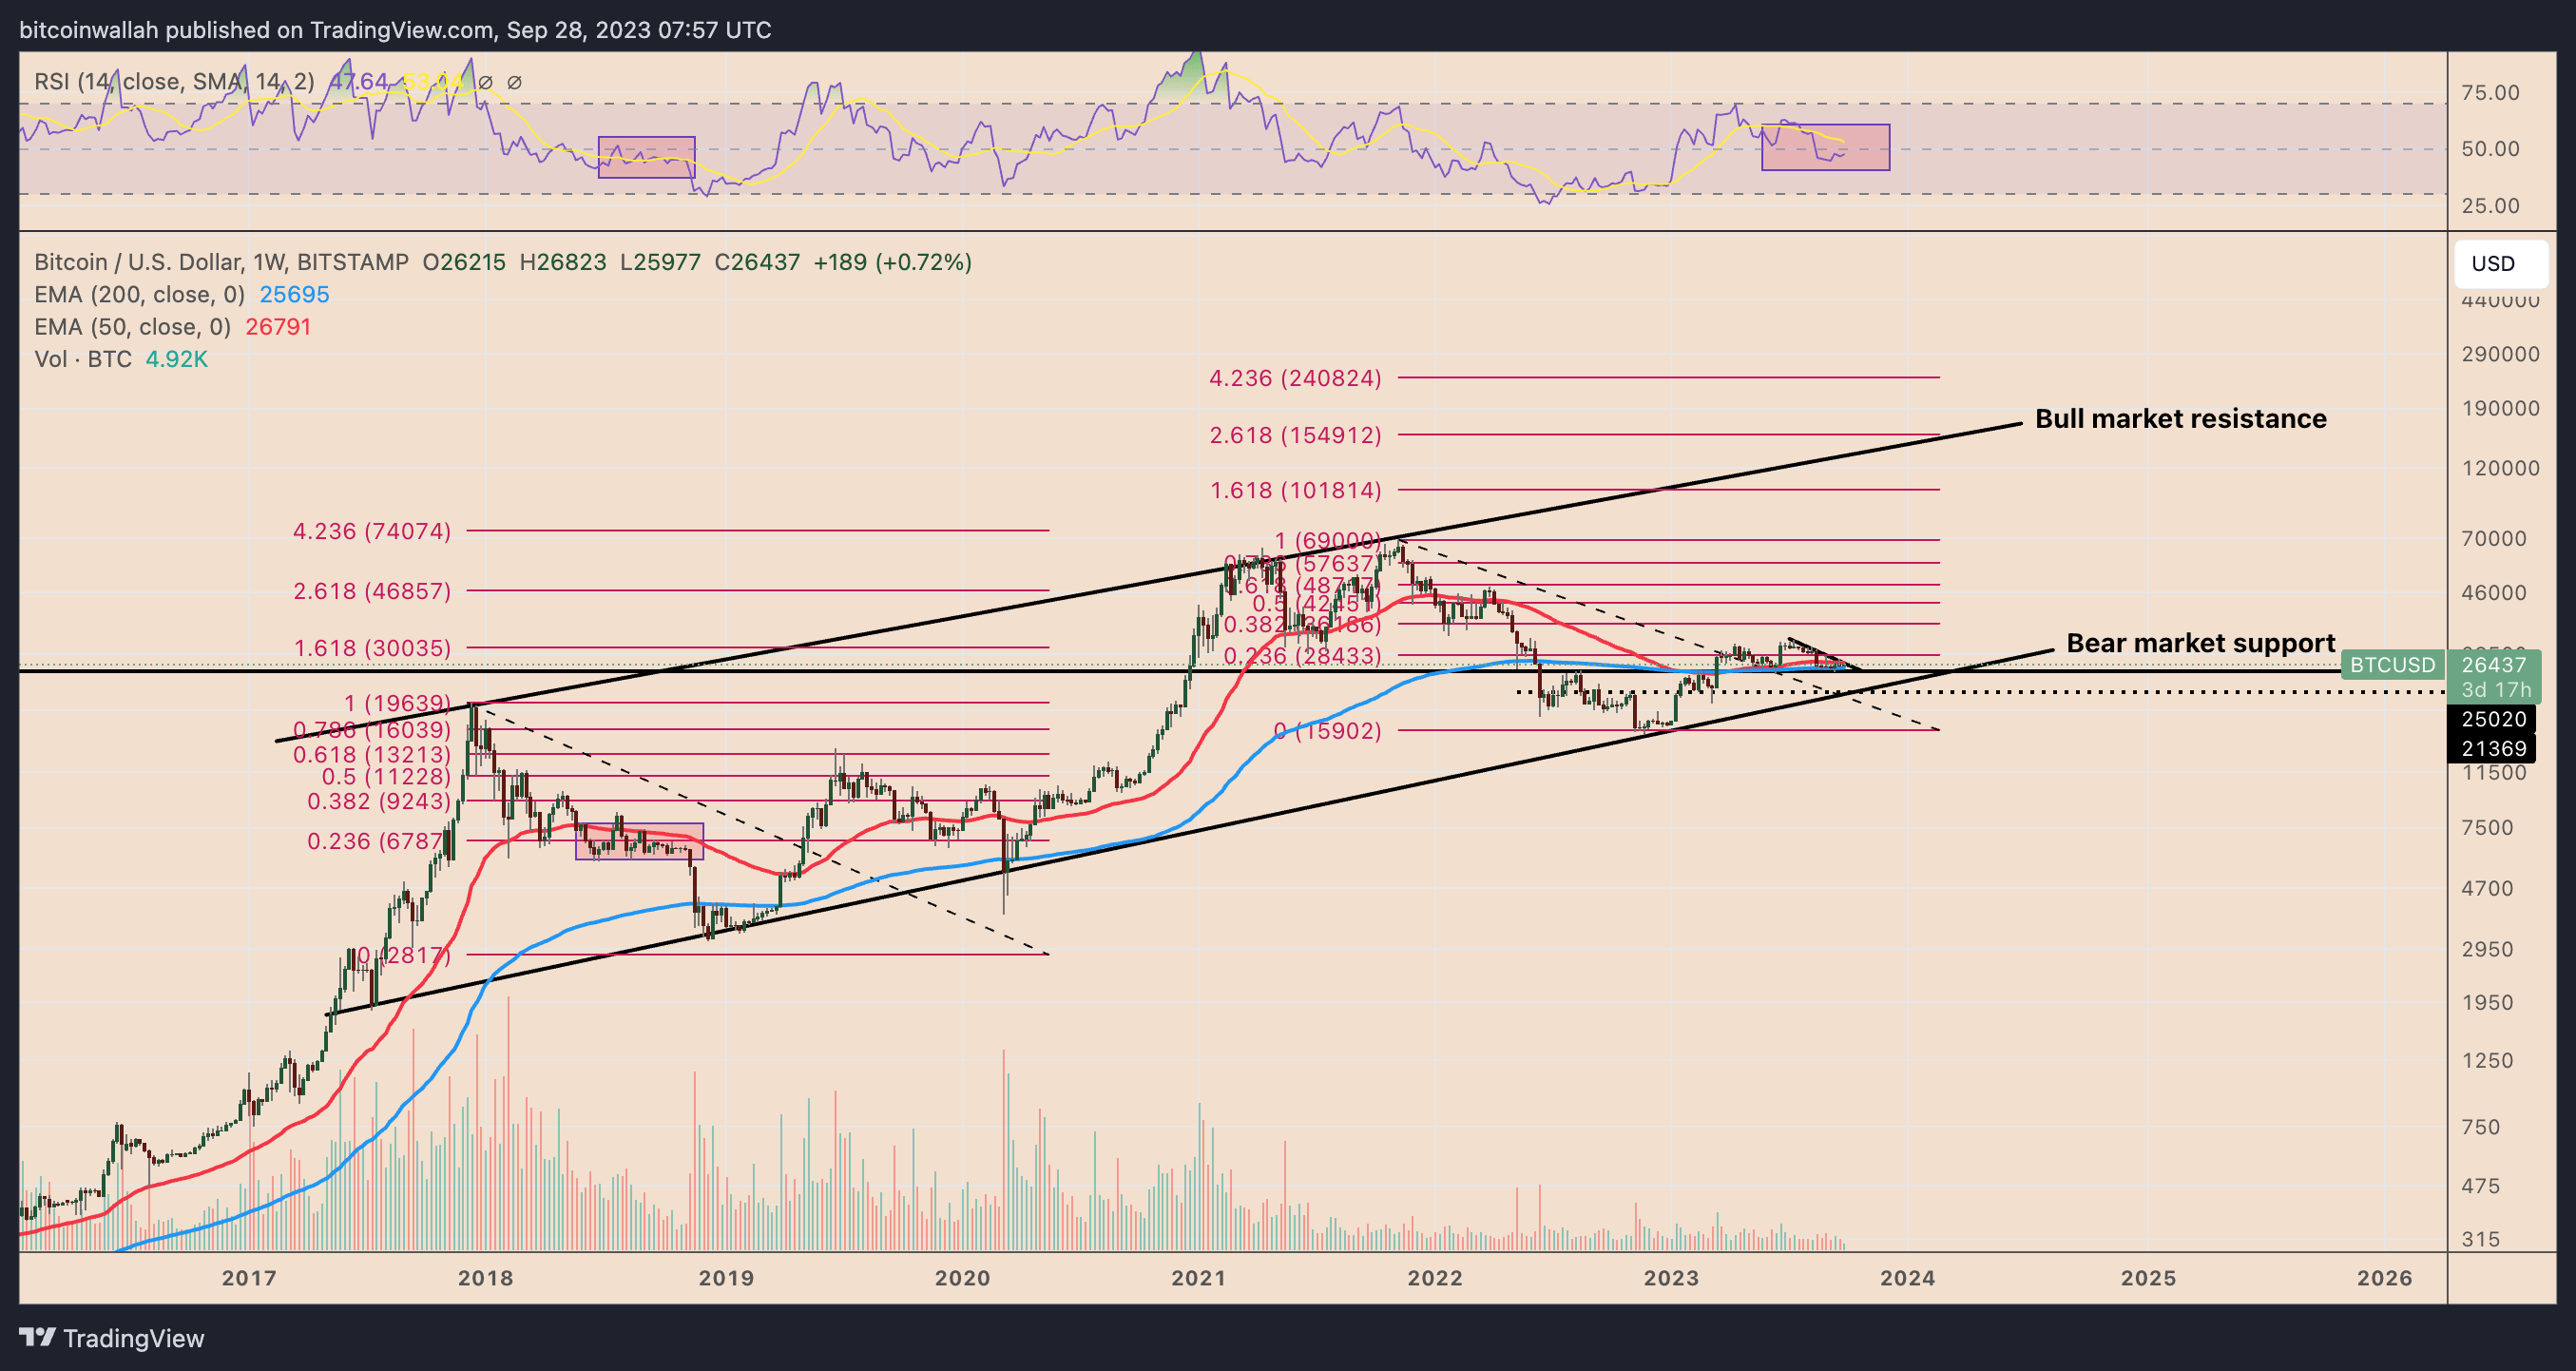
BTC/USD weekly price chart. Source: TradingView
In 2018, the BTC/USD pair stabilized around its 0.236 Fib line at around $6,790 for months before dropping toward $3,000 in December. The $3,000-level coincided with what is now a multi-year ascending trendline support (marked as bear market support in the chart above).
Bitcoin is now halfway repeating 2018 already with price flatlining at the 0.236 Fib line. A breakdown from this level meaning BTC price will see $21,500 as the next major support level, down 17.75% from current levels.
Strong Dollar adds to Bitcoin's downside risks
Meanwhile, the U.S. dollar strength index (DXY), which measures the greenback's strength against a pool of top foreign currencies, has reached its highest level since November 2022.
The index has been negatively correlated with Bitcoin throughout 2023, as shown below.
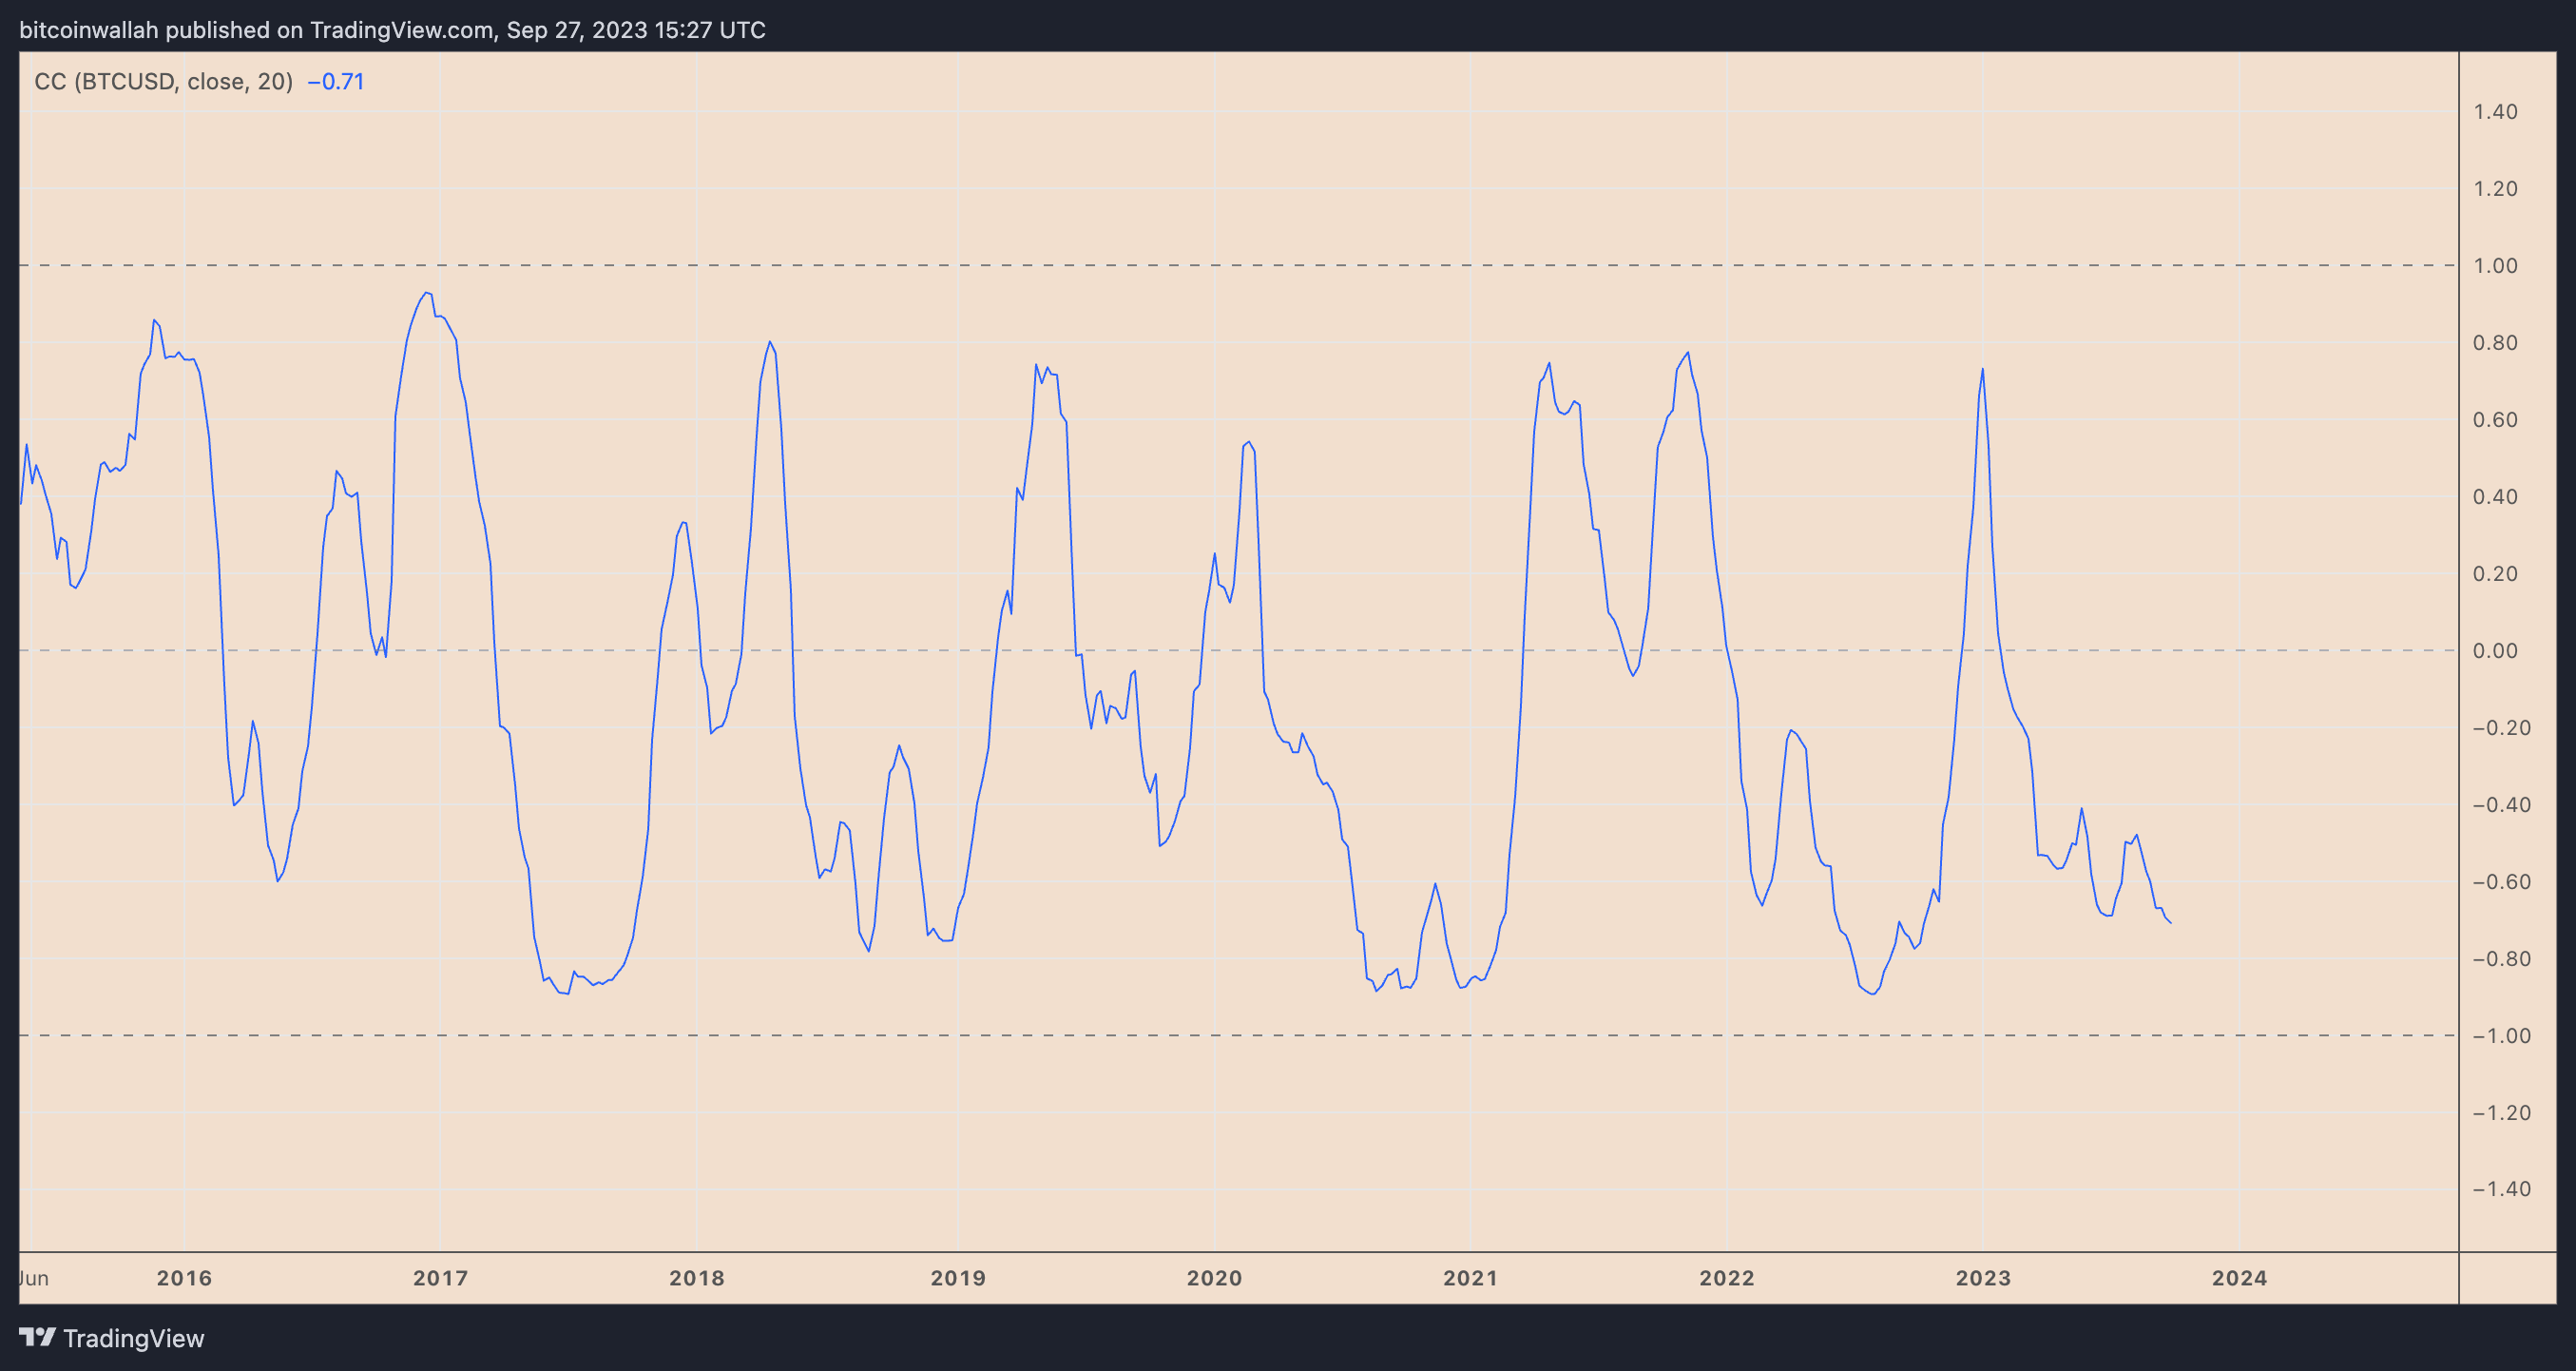
BTC/USD vs. DXY weekly price chart. Source: TradingView
The dollar's advance has accelerated after the Federal Reserve's rate decision last week, and the DXY is currently painting its 11th consecutive green weekly candle.
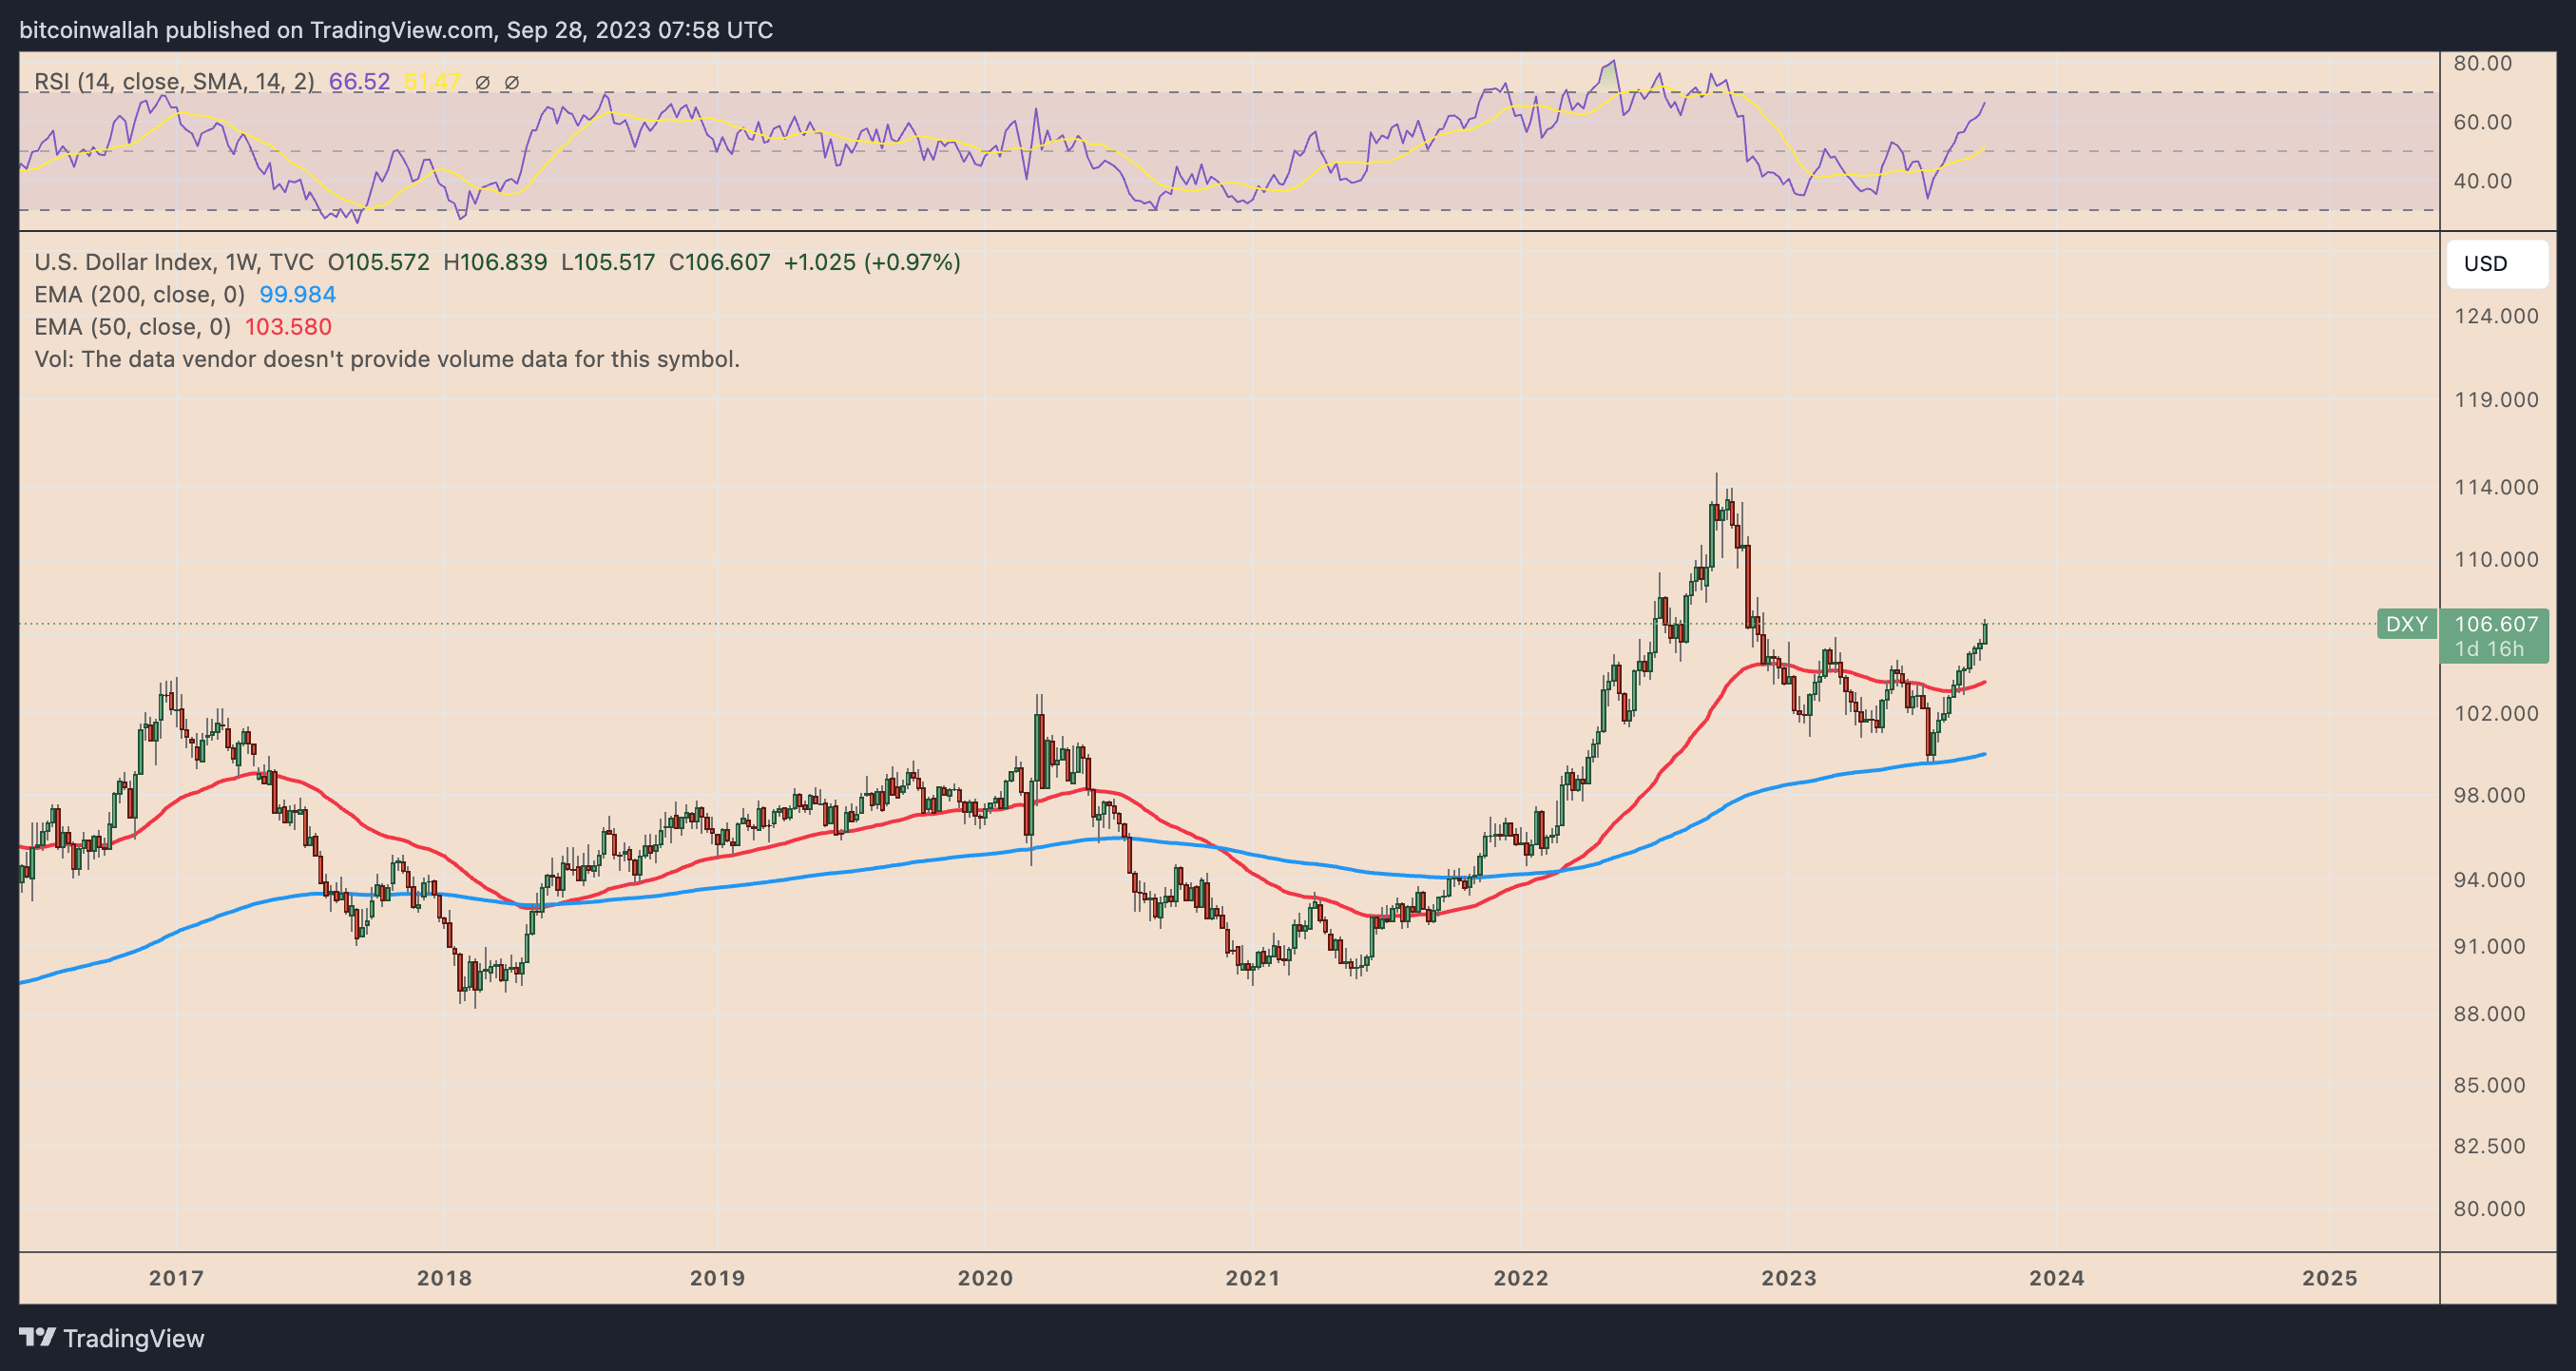
U.S. dollar index weekly performance chart. Source: TradingView
In other words, Bitcoin's upside prospects could be limited if the dollar continues to climb following the DXY golden cross.
"Old" Bitcoins being sold?
Bitcoin's on-chain metrics are painting a mixed outlook.
Bitcoin's Coin Day Destroyed (CDD) metric, measuring long-term investors' actions, spiked on Sep. 19, indicating that some long-term BTC holders moved their coins, suggesting possible profit-taking or repositioning.
Traders should take caution here as most CDD spikes have historically preceded price declines.
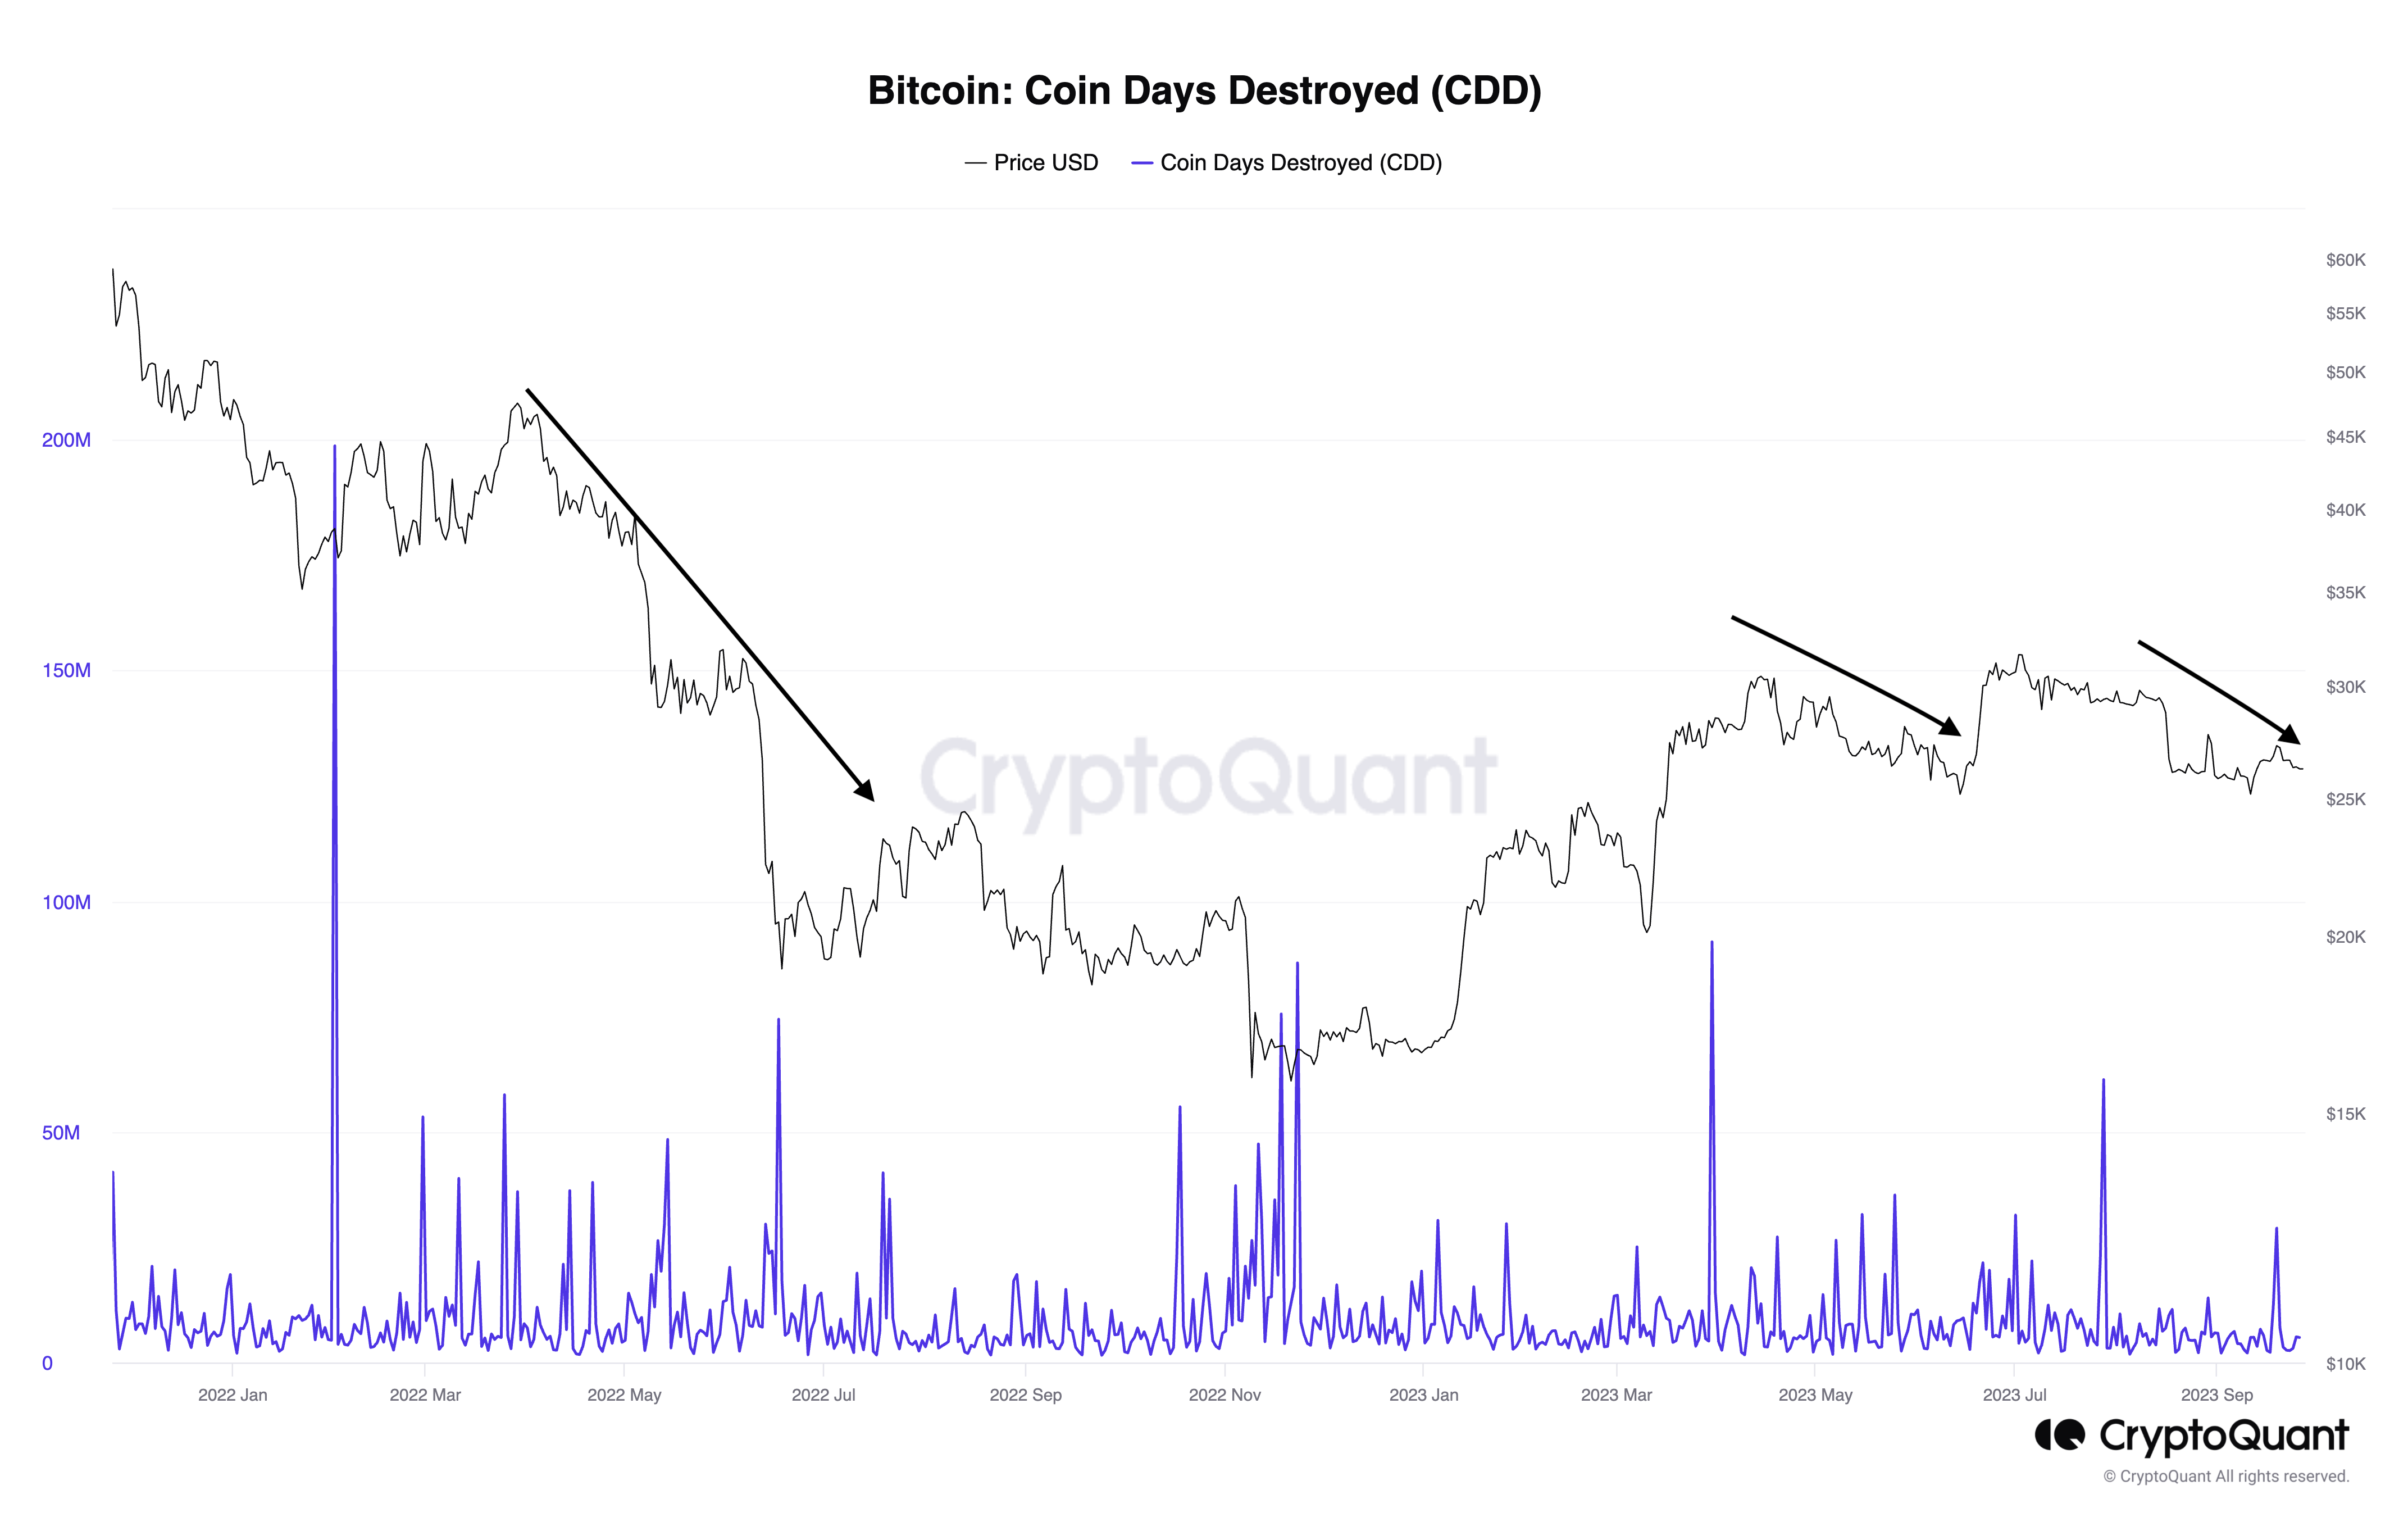
Bitcoin Coin Day Destroyed. Source: CryptoQuant
On the other hand, Bitcoin reserves across all crypto exchanges continue declining, which hints at increasing hodling behavior among investors.
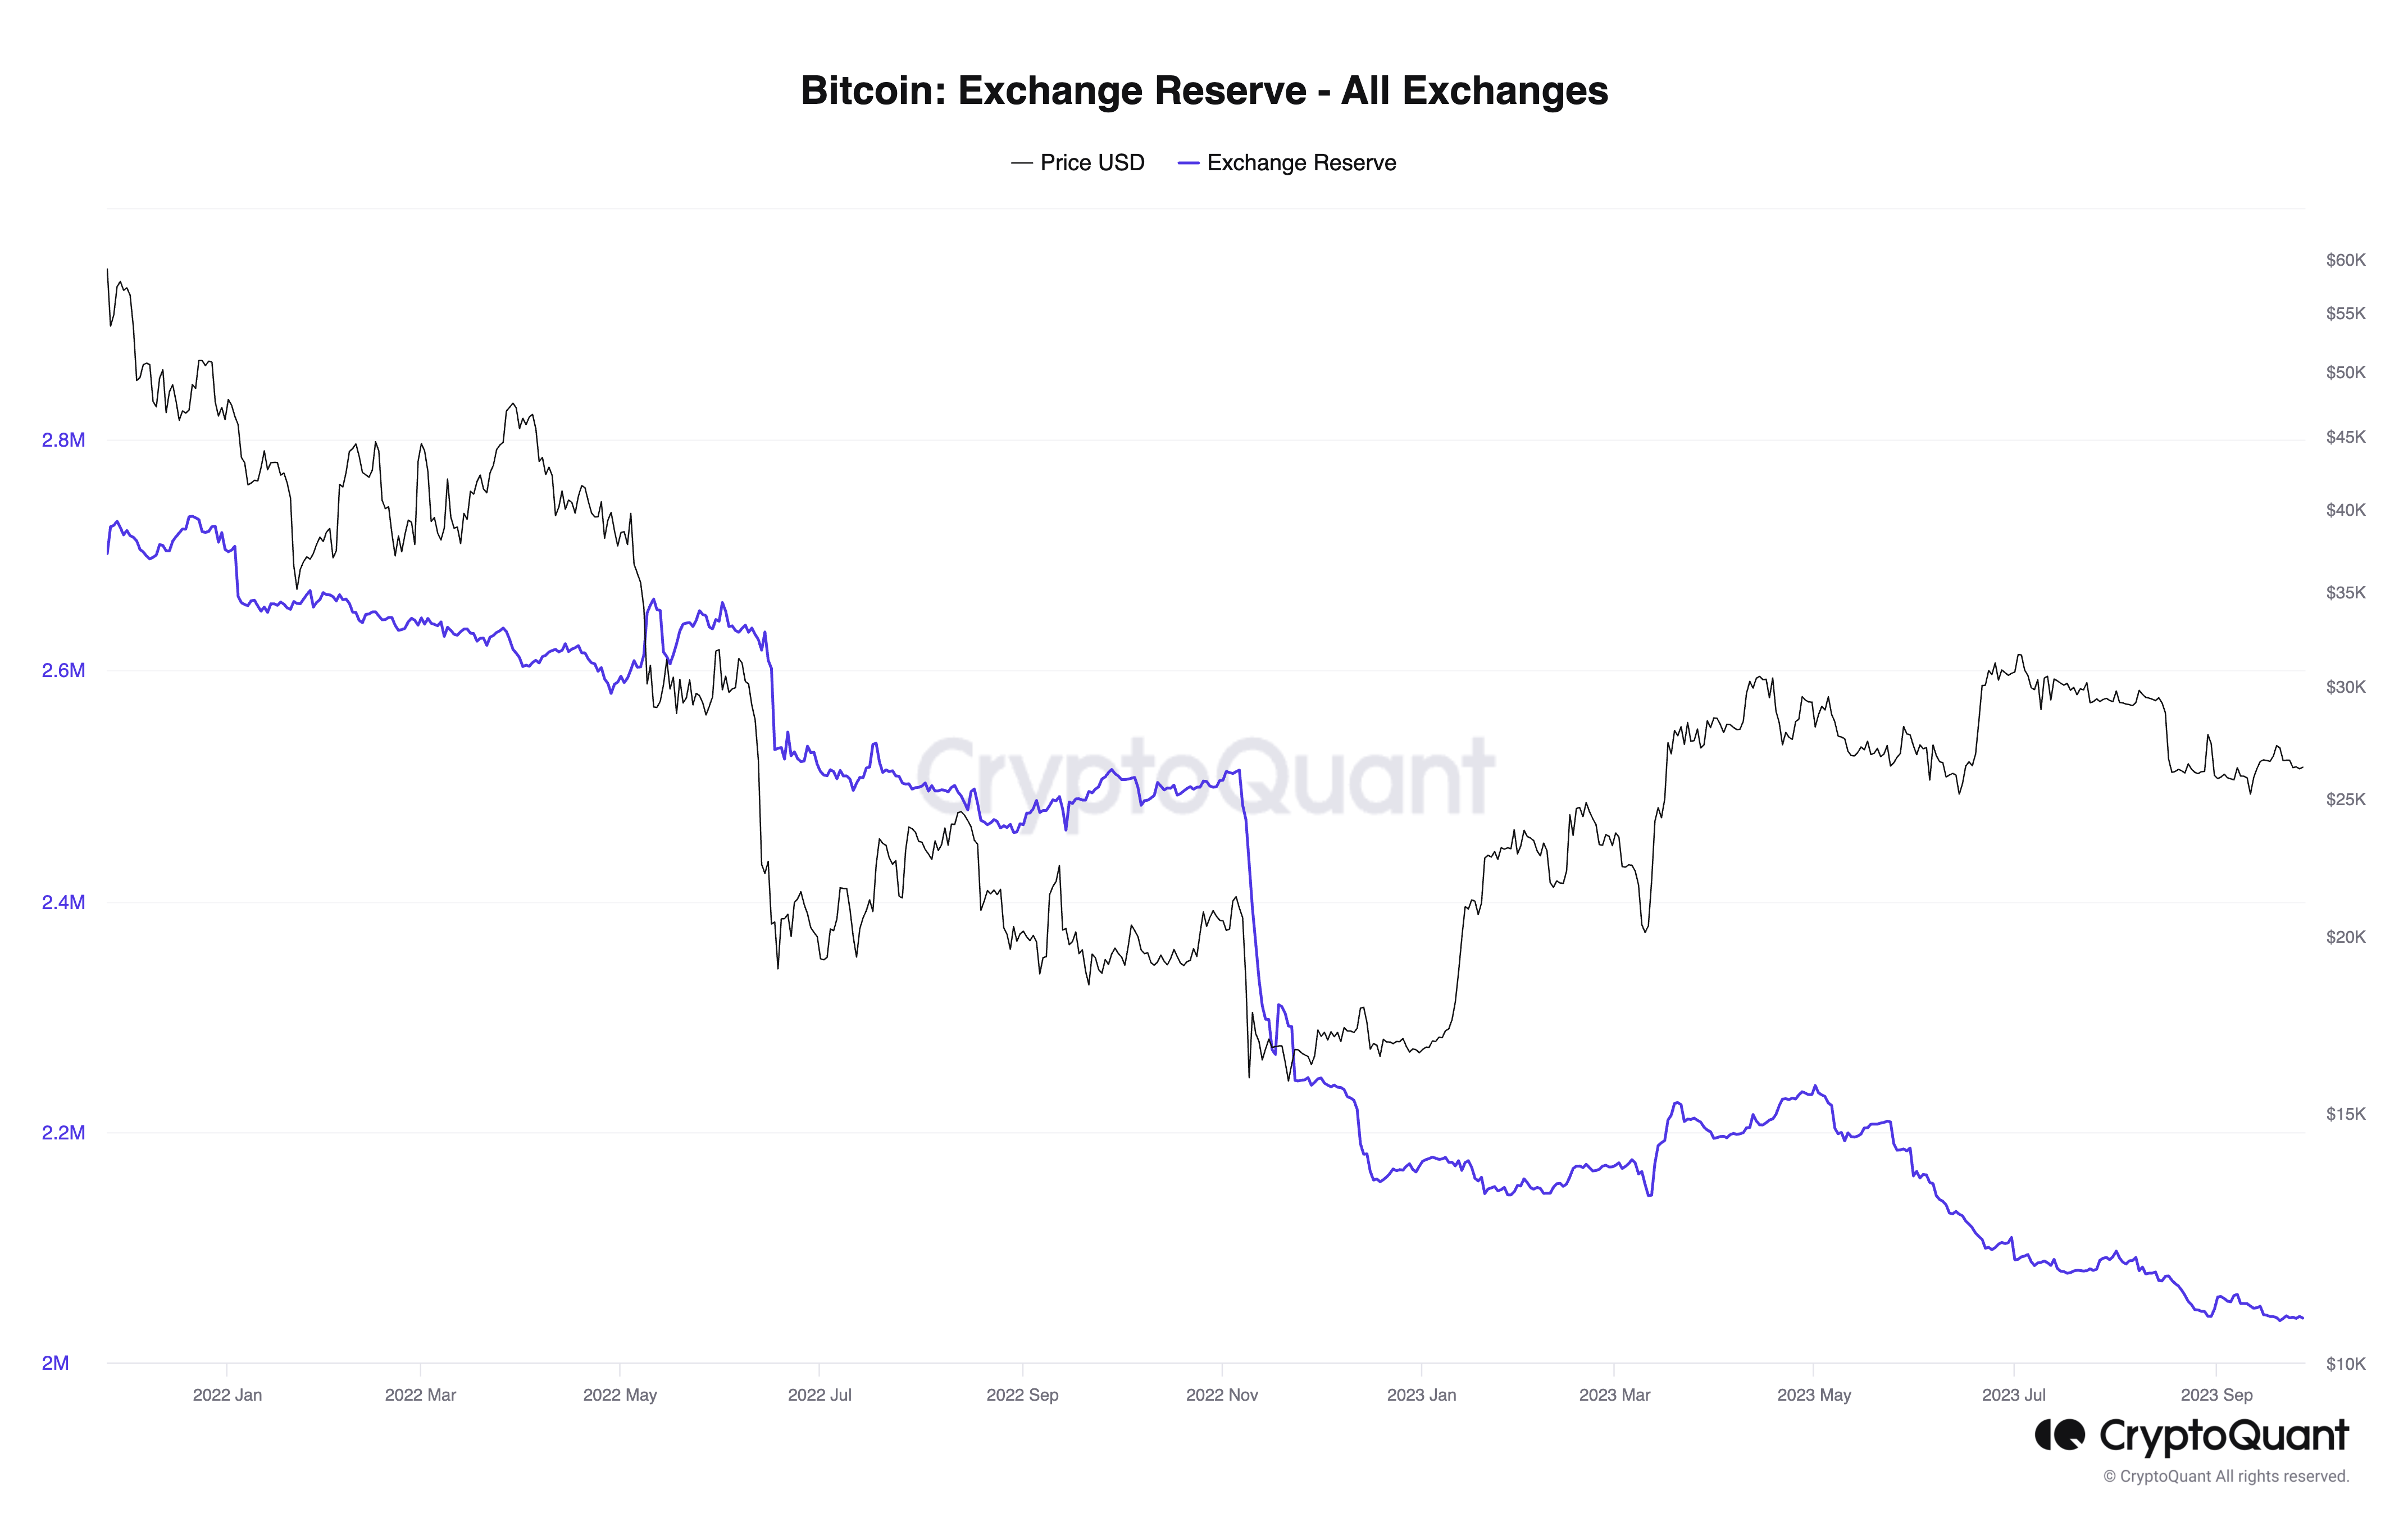
Bitcoin exchanges' BTC reserves. Source: CryptoQuant
What Bitcoin trading analysts are saying
Bitcoin analysts are also divided over where BTC price may be headed in the months ahead.
For instance, popular trader Skew argues that the BTC price can hit $30,000 by October, citing a thin Ask liquidity near $27,000, possibly leading to a breakout.
Fellow analyst Rekt Capital, however, doesn't rule out a price correction toward $18,000 based on a pre-halving fractal shown below.
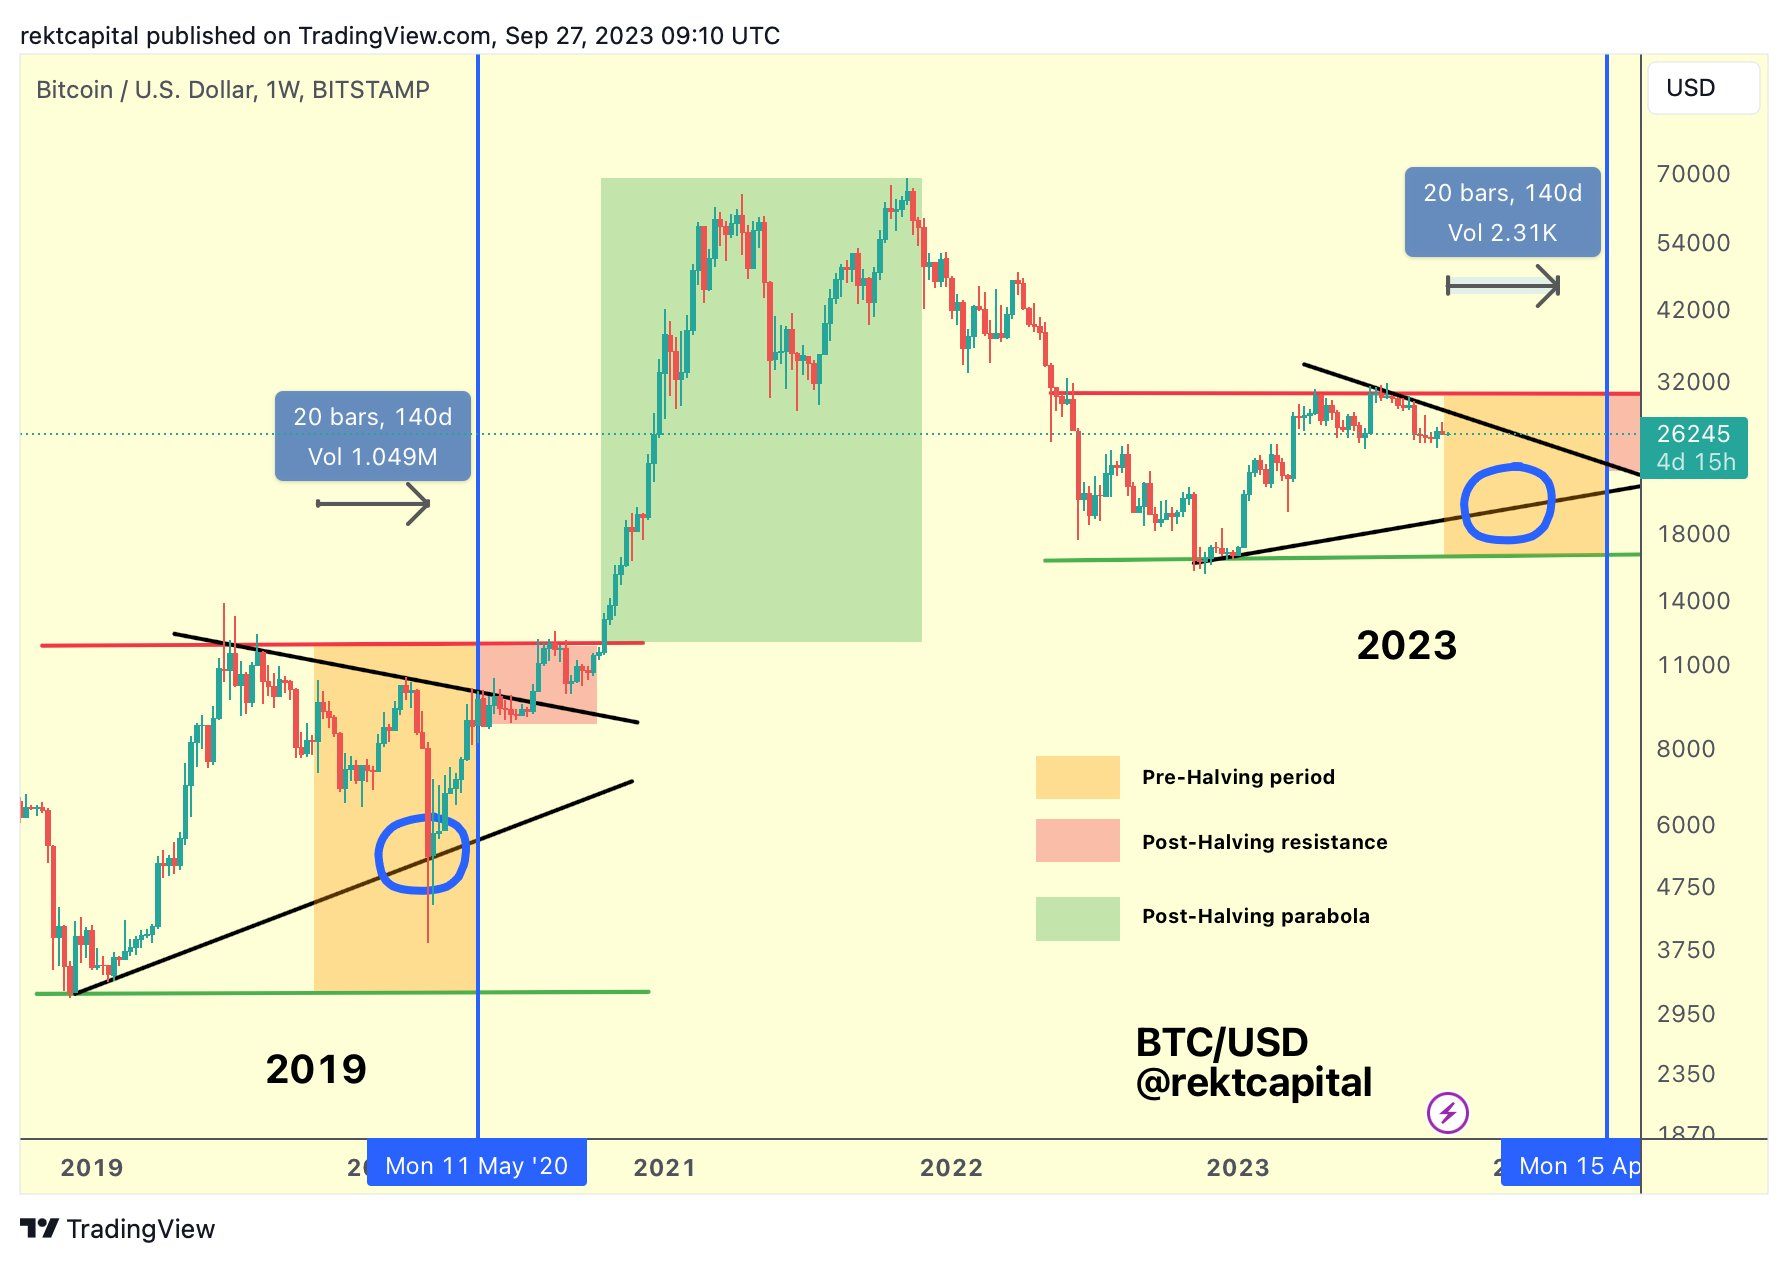
BTC/USD weekly price chart. Source: TradingView/Rekt Capital
"History suggests that the next 140 days will be crucial for dollar-cost-averaging in preparation for the Post-Halving parabolic rally," said Rekt Capital, adding:
If Bitcoin is going to retrace from [the current price levels], it will most likely be during this current 140 day period.
Author

Cointelegraph Team
Cointelegraph
We are privileged enough to work with the best and brightest in Bitcoin.


